Skip to main content
Close
Search
Help
Topics
Features
Blogs
Video
Podcasts
Magazine
Archive
Subscribe
Newsletter
About Us
Advertise
Login
Register
Twitter
Facebook
YouTube
LinkedIn
American Scientist
Open navigation
Search
Help
Login
Blogs
Macroscope
From The Staff
Macroscope
Science Culture
The Long View
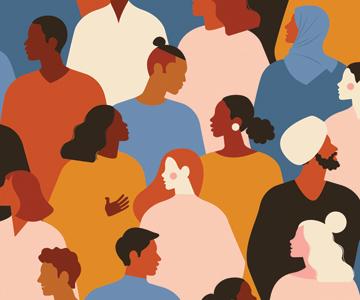
Unscrambling the Signal of Higher Vaccine Exemptions
Brian G. Southwell
,
Mary Klotman
,
Reed V. Tuckson
Macroscope
Medicine
Immunology
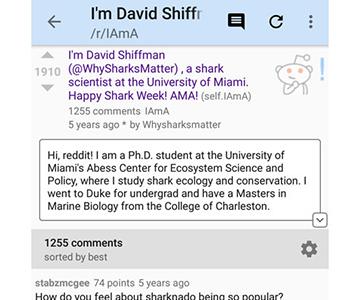
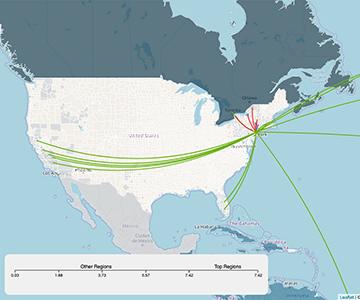
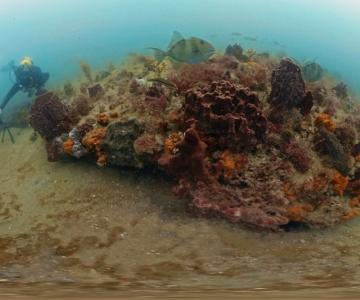
An All-of-Government Approach to Saving the Ocean
David Samuel Shiffman
Macroscope
Economics
Policy
Nature Conservation
Oceanography
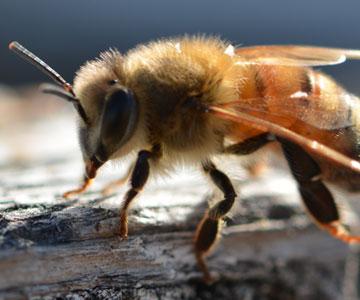
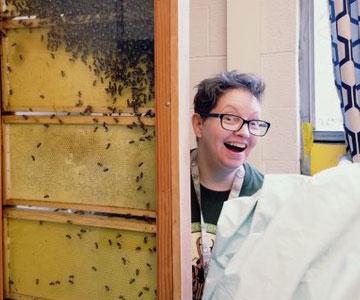
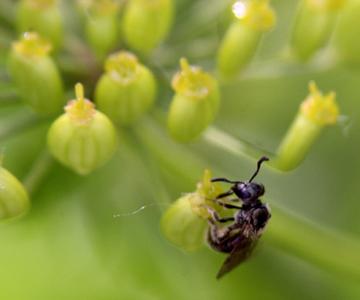
Brooding Over Bees
Marlo Chapman
Macroscope
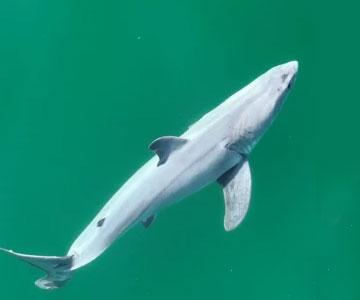
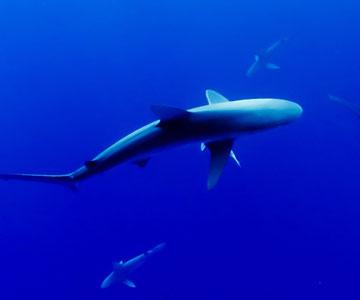
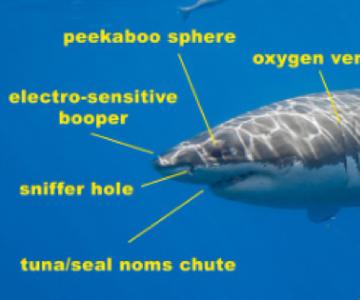
Baby Shark Sighting Misrepresented in Media Coverage
David Samuel Shiffman
Macroscope
Biology
Communications
Environment
Ecology
Nature Conservation
Oceanography
Zoology
The Burgeoning Bluesky Science Community
David Samuel Shiffman
Macroscope
Communications
Technology
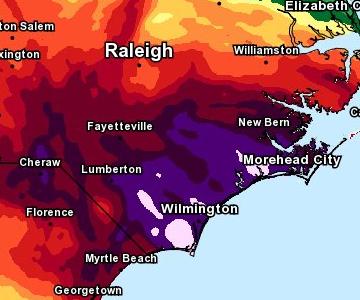
Learning from Rural Disaster Recovery
Kristen Fontana
Macroscope
Anthropology
Economics
Environment
Ethics
Policy
Sociology
Climatology
Social Science
How to Speed Up Virus Detection
Natalie Nold
Macroscope
Medicine
Technology
Virology
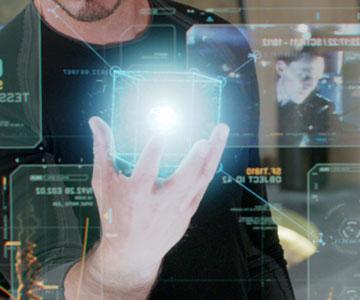
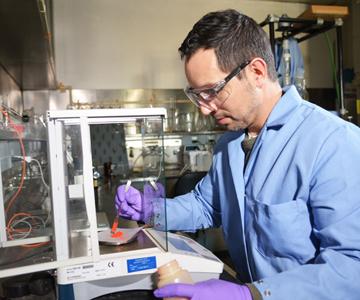
Advances in Personalized Medicine
Raeanne Geffert
Macroscope
Biology
Chemistry
Medicine
Technology
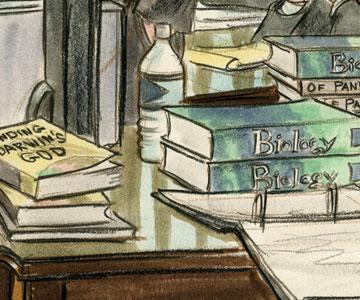
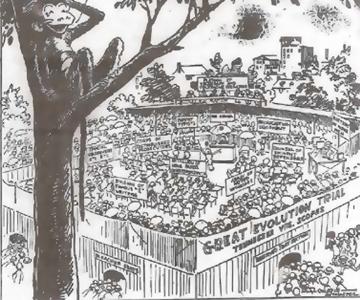
Human Evolution Belongs in the Science Classroom
Glenn Branch
Macroscope
Biology
Evolution
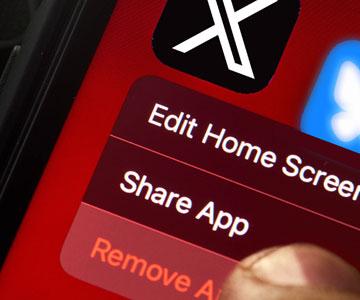
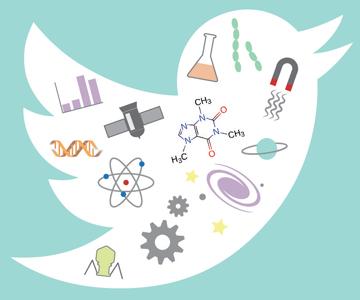
What We Lose If We Lose Science Twitter
David Samuel Shiffman
Macroscope
Communications
Technology
Information resources (general)
Why Permanent Standard Time Is Best for our Bodies
Erin E. Flynn-Evans
,
Cassie J. Hilditch
Macroscope
Biology
Evolution
Medicine
Animal Behavior
It's Time to Stop Gatekeeping Medical Transition
Henri Feola
Macroscope
Ethics
Medicine
Policy
Psychology
Social Science
Rank Injustice: What Your Favorite Music Says About Inequality in Science
Adam Shapiro
Macroscope
Ethics
Policy
Psychology
Sociology
What Science Writing Owes to Its Religious Origins
Adam Shapiro
Macroscope
Communications
Theology
Does In-Person Schooling Contribute to COVID-19 Spread?
Jennifer Dowd
,
Chloe Gibbs
,
Lindsey Leininger
Macroscope
Medicine
Policy
Virology
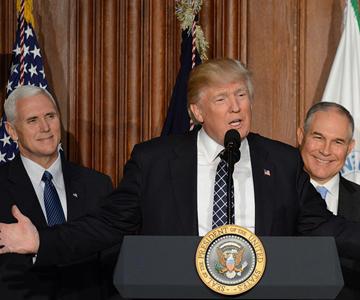
Executive Order Hinders Scientific Inquiry
Adam Shapiro
Macroscope
Ethics
Sociology
Social Science
Ending the War on Drugs
Amanda Latimore
Macroscope
Sociology
Social Science
What It Will Take to Reopen Schools Safely
Sandra Albrecht
,
Malia Jones
,
Aparna Kumar
,
Lindsey Leininger
Macroscope
Ethics
Medicine
Policy
Did Intelligent Design Just Miss Its Corona Moment?
Adam Shapiro
Macroscope
Evolution
COVID-19 Reveals a Path Forward on Climate Change
Richardson Dilworth
,
Scott Gabriel Knowles
,
Franco Montalto
,
Mimi Sheller
Macroscope
Environment
Policy
Climatology
Human Ecology
COVID-19 Models Demand an Abundance of Caution
Timothée Poisot
Macroscope
Computer
Mathematics
Medicine
Data Collection During Social Distancing
David Samuel Shiffman
Macroscope
Biology
Communications
COVID-19, Campus Closures, and the Rise of the #VirtualDefense
David Samuel Shiffman
Macroscope
Communications
Technology
Heat, Illness, and Hope in Coal Country
Ruoding Shi
Macroscope
Economics
Environment
Medicine
Optimal Conditions for Viral Transmission
Cassandra Hockman
Macroscope
Biology
Medicine
Virology
Answers to FAQs About the Coronavirus Pandemic
Jessie Abbate
Macroscope
Biology
Medicine
Virology
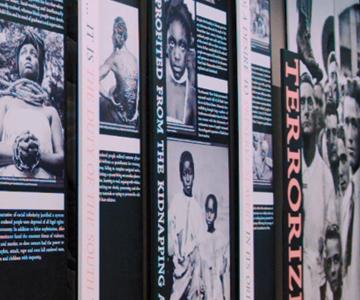
The Dangerous Resurgence in Race Science
Adam Shapiro
Macroscope
Ethics
Navajo-Led Science in Pursuit of Environmental Justice
Gabriela Serrato Marks
Macroscope
Environment
Ethics
Human Ecology
To Boldly Know: Why Scientists Should Care About Science Fiction
Kristen Koopman
Macroscope
Art
Psychology
Technology
The Danger of Viral Falsehoods in Conservation
David Samuel Shiffman
Macroscope
Communications
Environment
Ethics
Policy
Nature Conservation
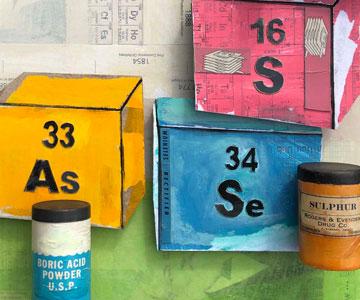
The Periodic Table at 150
Eric Scerri
Macroscope
Chemistry
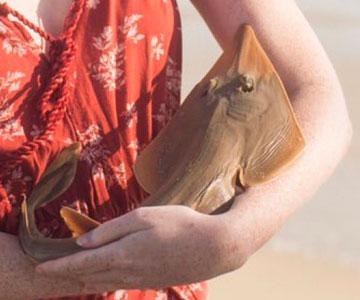
Welcome to the world,
Pseudobatos buthi
!
David Samuel Shiffman
Macroscope
Biology
Photography
A Digital Walk in the Woods
David Samuel Shiffman
Macroscope
Communications
Environment
Technology
Ask Me Anything about Science Outreach
David Samuel Shiffman
Macroscope
Communications
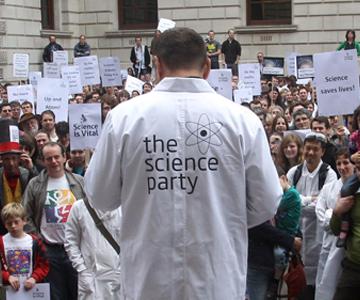
Visibility May Be the Key to Increasing Support for Science
Jamie L. Vernon
,
Mary Woolley
Macroscope
Communications
Scientists Who Selfie Break Down Stereotypes
Paige Brown Jarreau
Macroscope
Communications
Social Science
Do You Know Where your Food, Energy, and Water Come From?
Victor O. Leshyk
,
Benjamin L. Ruddell
,
Richard R. Rushforth
Macroscope
Agriculture
Policy
Technology
Geographical Distribution
Human Ecology
Go When the Audience Does
David Samuel Shiffman
Macroscope
Communications
People Cause Replication Problems, Not Machine Learning
Shlomo Engelson Argamon
Macroscope
Communications
Computer
Ethics
Technology
"Wild Green Memes" Facebook Group Is Pure Joy for Biology Geeks
David Samuel Shiffman
Macroscope
Biology
Communications
Ecology
What We Get Wrong About the Evolution Debate
Adam Shapiro
Macroscope
Biology
Evolution
Silly Anatomy Lessons Take Biology Twitter by Storm
David Samuel Shiffman
Macroscope
Biology
Communications
Anatomy
Natural History
Zoology
An "Invisible Gorilla" in the Lab
Kristen Koopman
Macroscope
Sociology
Social Science
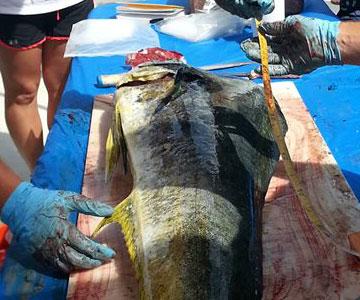
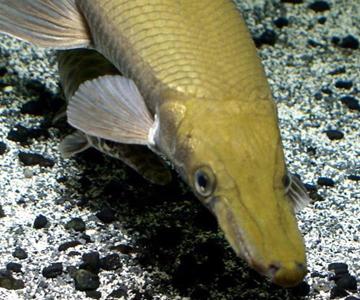
Angling for Ancient Fish
Solomon David
Macroscope
Biology
Environment
Ecology
Natural History
Nature Conservation
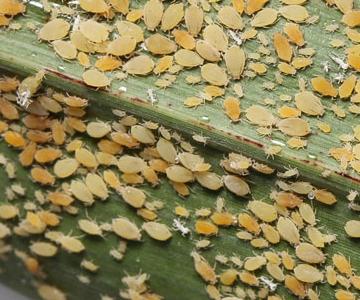
Sub-Saharan Africa's Women Protect Their Crops from a New Pest
Laura Kraft
Macroscope
Agriculture
Environment
Ecology
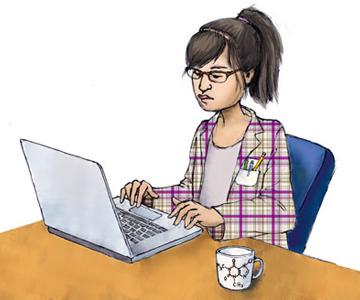
Who Reads Science Blogs?
Paige Brown Jarreau
Macroscope
Communications
Sociology
Information resources (general)
Social Science
Go Scuba Diving in a Marine Sanctuary—Without Leaving Your Desk
David Samuel Shiffman
Macroscope
Biology
Communications
Environment
Technology
Ecology
Nature Conservation
Oceanography
Becoming a Politically Engaged Scientist
Asia Murphy
Macroscope
Ethics
Policy
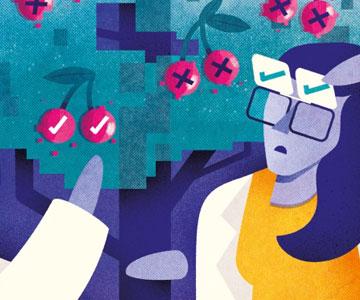
Don’t Strengthen Statistical Significance—Abolish It
Shlomo Engelson Argamon
Macroscope
Ethics
Statistics
Studying the Light of the Eclipse
Gregory J. Gbur
Macroscope
Astronomy
Physics
Scientists Must Challenge What Makes Studies Scientific
Chanda Prescod-Weinstein
Macroscope
Anthropology
Sociology
Social Science
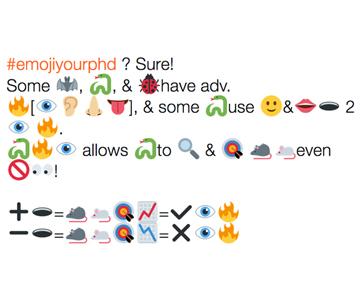
Scientists Explain Their Research Using Emoji
David Samuel Shiffman
Macroscope
Communications
Long Road to Academic-Market Success Presents Extra Challenges for Marginalized PhDs
Christie Bahlai
Macroscope
Communications
Ethics
Policy
Showing Up to Shape the Science March
Megan K. Halpern
Macroscope
Communications
Ethics
Policy
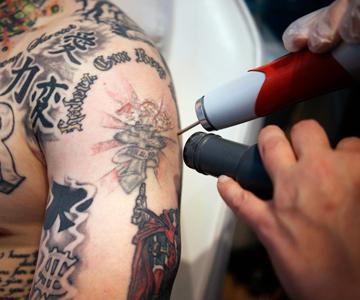
Undoing Tattoos
Raychelle Burks
Macroscope
Chemistry
March Mammal Madness, Science Communication's "Big Dance," Is Back
David Samuel Shiffman
Macroscope
Biology
Communications
Animal Behavior
News Flash: Science Has Always Been Political
Adam Shapiro
Macroscope
Ethics
Using Twitter Hashtags for Science Education
David Samuel Shiffman
Macroscope
Biology
Communications
Ecology
The Consequences of Freezing Federal Science Grants
Lisa Hayward
Macroscope
Environment
Ethics
Policy
The Benefits of Twitter for Scientists
David Samuel Shiffman
Macroscope
Communications
Ecology
Particle Colliders on the Horizon
Emily Thompson
Macroscope
Physics
The Evolution of the 21st-Century Scientist
Brian Kurilla
Macroscope
Communications
Fireworks Go Green
David Chavez
Macroscope
Chemistry
Environment
The World of Science Blogging
Paige Brown Jarreau
Macroscope
Communications
Social Science
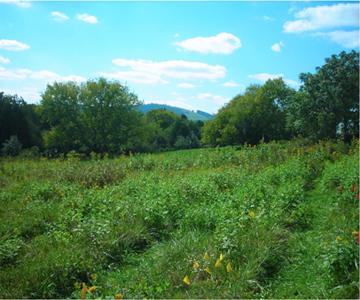
The Long Haul: Challenges and Rewards of Long-Term Ecological Studies
Carolyn Beans
Macroscope
Biology
Ecology
Emerging Entomology Research from a New Biodiversity Hotspot
Matthew Bertone
Macroscope
Agriculture
Biology
Ecology
A Glimpse of Infinity In the Swirling of Light
Gregory J. Gbur
Macroscope
Mathematics
Physics
Why Eric Lander’s Controversial Paper “The Heroes of CRISPR” Is Not Solid Historical Research
Michel Morange
Macroscope
Biology
Communications
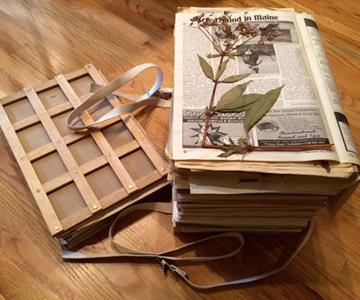
Confessions of a Herbarium-Savvy Field Biologist
Carolyn Beans
Macroscope
Biology
Botany
Ecology
Up Close with Lemur Gut Bugs
Lydia Greene
Macroscope
Biology
Going Rogue with Optical Waves in the Laboratory
Gregory J. Gbur
Macroscope
Physics
Pros and Cons of the U.S. Federal Strategy to Protect Pollinators
Kaitlin Stack Whitney
Macroscope
Agriculture
Environment
Policy
How Forensic Scientists Find a Dead Body—And How Microbes Can Help
Raychelle Burks
Macroscope
Chemistry
Internships Connect Math Students to New Career Paths
Rachel Levy
Macroscope
Mathematics
Statistics
6 Misconceptions About Saving the Bees
Kaitlin Stack Whitney
Macroscope
Biology
5 Reasons to Teach Mathematical Modeling
Rachel Levy
Macroscope
Communications
Mathematics
Beating Cancers' Unexpected Vice: Transcription
Brian J. Abraham
Macroscope
Biology
Chemistry
Genetics
Why More Biologists Need to Teach in Africa
David C. Blackburn
Macroscope
Biology
Policy
Regulatory DNA Variants in Disease: Too Much (or Too Little) of a Good Thing
Brian J. Abraham
Macroscope
Biology
Genetics
Macroscope, Rebooted
Katie L. Burke
Macroscope
Communications
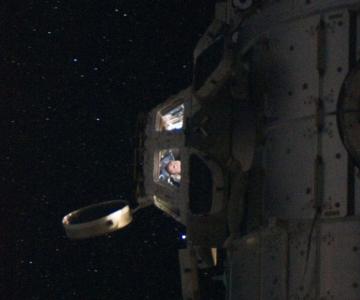
The Relaunch of an Ocean Workhorse
Heather Olins
Macroscope
Biology
Oceanography
Load more
×
AMSCI ICON NAVIGATION:
Navigation Menu
Search
Help
Log In, Register
My AmSci
Select Options
(not present on all pages)
Click "American Scientist" to access home page
×