Ecologist Greg Asner, of the Carnegie Institution for Science in Stanford, California, and his team developed the Carnegie Airborne Observatory to scale up the old-school forestry data gathered by ecologists on the ground and in the trees.
Tropical ecologists have a long tradition of tromping through the forest in rubber boots, tracking the fates of individual trees and perhaps scaling some of these 50-meter giants to sample their foliage. But forests—and the conservation issues they face—dwarf even the most ambitious on-the-ground studies. Ecologist Greg Asner, of the Carnegie Institution for Science in Stanford, California, and his team developed the Carnegie Airborne Observatory to scale up the old-school data. The observatory consists of three remote-sensing instruments on board a Dornier 228 airplane. The resulting images of vast tracts of forest, interpreted in light of complementary data collected from individual trees, reveal information about forest ecology, diversity and health. Asner spoke with American Scientist associate editor Elsa Youngsteadt about the project.
What research instruments are on board the observatory?
There are three major instruments suspended over a big hole in the back of the plane, looking out. The first one is a high-fidelity imaging spectrometer, which measures sunlight reflected off the vegetation. Sunlight interacts with the molecular composition of the leaves, and those molecules bend, vibrate, rotate and stretch at certain frequencies associated with their chemical composition. So the way each tree canopy scatters light tells us which molecules are in its leaves. Our spectrometer is unique in that it can measure light from ultraviolet, around 380 nanometers, through the visible spectrum and all the way up to shortwave infrared, around 2,510 nanometers. And it does that in little 5-nanometer slices. When you take a photo with a digital camera, it usually has three bands: red, green and blue. Ours has 420 bands.
The second instrument is a LiDAR, which stands for light detection and ranging. It uses two lasers, firing up to 400,000 times per second, to create a 3-D image of the forest canopy and the terrain below it. The third technology is another spectrometer. It doesn’t measure as much of the spectrum as the first one, but it has a spatial resolution that’s four times higher.
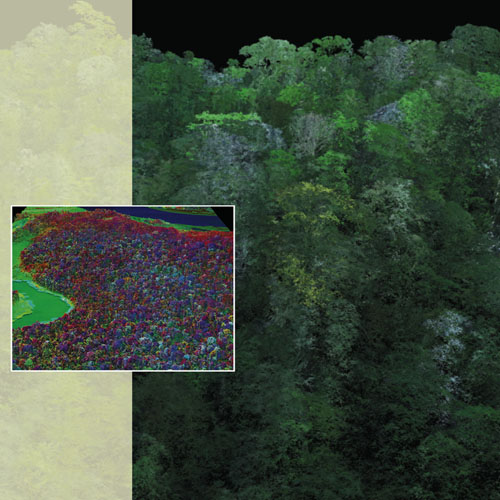
These false-color images encode information about the chemical diversity—and thus the ecology—of trees in the Peruvian Amazon. Here,
the darkest green canopies contain the greatest density of carbon-based herbivore deterrents, such as polyphenols. The inset represents more complex chemical information: Colors reflect the abundance of not only defense- and longevity-related compounds, but also growth-related compounds and others. That chemical variation is often enough to identify individual tree species, and even for unidentified plants, it reveals ecological information. The reddest individuals, for example, are growing the fastest, and the blue ones are heavily defended against herbivores. The Carnegie Airborne Observatory, which can cover thousands of square kilometers and log up to 2 terabytes of data per day, has greatly expanded the geographic area over which such data can be collected.
Images courtesy of the Carnegie Airborne Observatory.
Ad Right
How do you integrate that information into a single image?
No one instrument does it all: If we only had a LiDAR, we would see the 3-D structure of the canopy with no color. If we only had a spectrometer, we could paint a map with chemical colors, but it would look 2-D. We’ve developed a lot of knowledge on how to make each spectral pixel from each spectrometer line up perfectly with the LiDAR pixels. We use the information that’s shared between all the instruments: timing, GPS data, and information from an IMU (instrument motion unit) that records the roll, pitch and yaw of the aircraft.
How do you get from one of these 3-D images to information about leaf chemistry and tree diversity?
We have a big database, which we call the spectranomics database, that was built by me, my colleague Robin Martin (who happens to be my wife) and a big team running around the tropics, climbing trees, getting foliage samples and specimens to identify. We use a field spectrometer to measure the spectral properties of the foliage in a way that will be compatible with the airborne spectra. And we have a big chemistry lab here where we reduce the foliar samples down to 21 chemical traits—from nutrients to defense compounds like phenols. So the database includes the spectral data, the chemical data and the taxonomic information. Sometimes we try to match the airborne spectra to the database to identify species in our images. More often, we use the database as a guide to look at communities of species.
Does this work have implications for conservation?
Conservationists who have a finite amount of dollars aren’t necessarily interested in every single species, but they’re interested in knowing where the hot spots are. And I can’t produce a map of every single species, but I can say, “Here’s an area that’s high biodiversity and here’s one that’s low.” We’re also trying to help conservationists look at forests in a new way. Our data show that tropical forests are not all functionally the same. They vary in carbon exchange or nutrient cycling or defense from herbivores, for example. Therefore, conservationists can apply their efforts to maintain a portfolio of functional variation.
Could you give an example of an insight you have gained into forest composition and function?
I flew heavily last July and August in the southern Peruvian Amazon. It was hit hard by the 2010 drought and I wanted to know how the tree communities were faring. We can use spectral and chemical markers to see areas where the canopy is extremely drought stressed, even though it looks green to the naked eye. Our images show specific tree communities that are more prone to drought stress. For example, you might think that species that naturally grow on infertile soils would already be stressed and that a drought could just wipe them out. But they’re actually the ones that have evolved to be very hardy, whereas communities that are naturally found on high-fertility soils or floodplains seem very vulnerable to drought.
American Scientist Comments and Discussion
To discuss our articles or comment on them, please share them and tag American Scientist on social media platforms. Here are links to our profiles on Twitter, Facebook, and LinkedIn.
If we re-share your post, we will moderate comments/discussion following our comments policy.