Reengineering the Electric Grid
By Thomas Overbye
Deregulation places new demands on one of the world's largest engineered structures—and presents new opportunities for educated consumers
Deregulation places new demands on one of the world's largest engineered structures—and presents new opportunities for educated consumers

DOI: 10.1511/2000.23.220
Most people give little thought to the source of the power that comes out of an electrical outlet. And why should they? The American electric power system was designed as the ultimate in plug-and-play convenience, seemingly as dependable as the sun rising in the morning.
For years, the regulated monopoly structure of the industry meant that consumers had no choice but to buy their power from the local utility. With no chance to shop around, most people had no incentive to learn how power is made, traded, moved from region to region and delivered on demand.

Bettmann/Corbis
But the process of deregulating this industry, moving quickly in some U.S. states and slowly in others, is beginning to change how we view electricity. Consumers, electric utilities and power generators find themselves in an unfamiliar competitive world, a situation that may lead to lower prices or, paradoxically, to new kinds of market imbalances that could drive prices higher. The reliability of America's electric grid, which has to date been unequaled anywhere in the world, is increasingly at risk. Highly interconnected to assure a power supply and predictable prices even when major components fail or demand soars, the electric network is governed by the laws of physics as much as economics. No part of the grid is sheltered from changes or failures in other parts. Therefore even states where consumers have no choice of a power supplier are affected by deregulation and the new issues of reliability and market fluctuations that it raises.
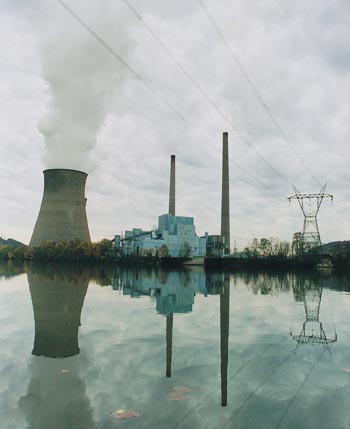
Excepting a few islands and some small isolated systems, the entire electrical grid in North America is really just one big circuit. The humble wall outlet is actually a gateway to one of the largest and most complex objects ever built. The grid encompasses billions of individual components, tens of millions of miles of wire and thousands of individual generators.
This high degree of interconnection has two primary benefits. The first is reliability: With thousands of generators interconnected through tens of thousands of transmission lines, the loss of even the largest generator or line has but a minuscule impact on the reliable operation of the system. When one device fails, others are able to make up for the loss. The second benefit is economic, providing the key to the development of power markets. Although the system was not built explicitly for bulk power transmission—the movement of large power loads from one region to another—utilities can buy and sell electrical energy to one another, taking advantage of differentials in the cost of electric service.
However, this connectivity also has a detrimental side effect: The power system can fail, and when it does it fails in complex and dramatic ways. Failures in one location can propagate through the network at almost the speed of light. Large-scale blackouts can quickly affect tens of millions, with losses reaching billions of dollars. Although the Northeast Blackout of 1965, in which more than 30 million people lost electrical service, was certainly a watershed event, the recent widespread outages of the Western Interconnect in 1994 and 1996, and the Eastern in 1999, prove that such failures are not just a part of the past. A key challenge to restructuring is how to set up an open electricity market on a huge electric circuit—while simultaneously keeping the lights on. This challenge was highlighted by U.S. Secretary of Energy Bill Richardson in March as he released a report by a Power Outage Study Team formed by his department. Under conditions of increasing demand, the grid's reliability, Richardson said, "is, at times, faltering, mainly because policy makers haven't kept pace with rapid changes in the electric utility industry."
This is a challenge with new dimensions. Other industries have been deregulated in the United States—trucking, oil, gas, airlines and telephone service, to name a few. As I shall explain below, the electric-power market differs from all of these. The product must always be manufactured exactly when needed, producers continually matching a demand that fluctuates significantly with conditions such as weather. The transmission system's load and its capacity to handle the load are in constant flux, and congestion at any point affects all other parts of the system. As deregulation progresses from state to state, its apparent impact on consumers will vary widely. But behind the scenes, power-systems engineers have their work cut out for them.
The modern electric utility industry got its start back in the early 1880s with the opening of Thomas Edison's Pearl Street station in Manhattan, which initially provided a grand total of 59 customers with direct-current, or DC, electricity. Suddenly the night could be banished by the brilliance of electric light, rather than held at bay by a flickering flame. The popularity of the new invention soared: By the end of the 1880s, DC electric systems were common in many cities.
However, direct current could only be distributed over a few city blocks because of the inefficiencies that then limited DC transmission. The reason lies in two simple laws of physics. The power transmitted through an electric line (commonly expressed in watts, kilowatts, megawatts and so on) is proportional to the voltage times the current. But power lines are not perfect conductors, and there is always power lost to resistance. This loss is proportional to the square of the current. Hence, the way to transmit power efficiently over a long distance is to keep the voltage high and the current low. But in a DC network voltage cannot easily be stepped up or down; hence the early distribution systems had to maintain low voltages throughout in order to provide low-voltage power to the end user.
Edison's DC networks, therefore, were doomed to obsolescence. George Westinghouse championed a better idea: alternating current, or AC. With AC systems, the voltage on a line can be changed by a simple device, the transformer. Electricity can be transmitted at high voltages, with transformers stepping up the voltage at the generator and then stepping it down to relatively low voltages for household use. By 1896, AC lines delivered electricity from generators at Niagara Falls to Buffalo, some 20 miles away. The AC transmission grid was born.
A problem quickly developed. Electric power was a natural monopoly. Centralized systems with larger generators that reduced costs and attracted business customers were clearly more efficient than specialized generators and masses of wires. Private monopolies began to emerge, and states stepped in to regulate them, establishing public commissions with the authority to grant a private investor-owned utility an exclusive franchise to serve all the customers in a particular geographic location. Interstate holding companies began buying up these utilities and were in control of most of the power market by the 1920s. After several of these holding companies collapsed, Congress passed the Public Utility Holding Company Act of 1935 (PUHCA), and a national regulatory system was born. Electric utilities were established as vertically integrated natural monopolies serving captive markets. In return for their exclusive franchise the utilities had an obligation to serve all existing and future customers within their service territory, with many aspects of their business operations, including their electric rates, regulated by the states. It was a cost-plus business: The utility and regulators determined the allowable expenses, which were used to determine the customer rates, which the customers (known then as ratepayers) had to pay.
Control of the electric transmission grid was centralized, with the grid shared by utilities that functioned more as colleagues than competitors, all operating under the same monopolistic paradigm. Private, investor-owned utilities provided electric service to the vast majority of consumers, with municipal systems, rural cooperatives and federal systems (such as the Tennessee Valley Authority) meeting the needs of the rest.
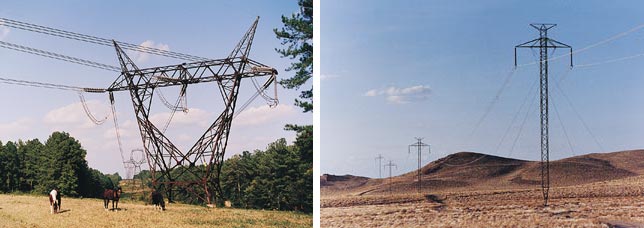
Until the early 1970s there were few complaints with this system. Electric rates were steadily decreasing while electric usage skyrocketed, with average annual growth rates above 10 percent during the first third of the century and then in the seven to eight percent range until 1970. The vertical monopoly structure provided a stable basis for building an extensive and fairly reliable system. In an era where economic progress was tied to economies of scale, large power plants, and the high-voltage transmission system needed to move the power from these plants to the customers, could be engineered, built and operated with the assurance that legitimate costs could be passed on to the ratepayers. By 1970 transmission lines crisscrossed the continent, with operating voltages up to 765 kilovolts.
Data from the Energy Information Administration. Aaron Cox
Today the North American power grid consists of four large subsystems. Each is a synchronous AC system, meaning all of the electrical generators and motors are operating in phase with one another. The Eastern Interconnect supplies power to most users east of the Rocky Mountains. The Western Interconnect supplies most users west of the Rockies and portions of northern Mexico. Two subsystems operate with relative independence: The Quebec Interconnect covers that Canadian province, and the Texas Interconnect makes Texas the only state whose electricity is not regulated as interstate commerce. The problem of connecting these systems so as to allow specified power transfers among them has been solved, as it happens, by bringing back direct current. With the development of high-voltage DC transmission technology, DC lines with power-conversion facilities at each end have turned out to be highly economical for transferring power asynchronously between subsystems.
Change came suddenly to what seemed a fairly efficient regulated system. The 1970s brought inflation, increased fossil-fuel prices, calls for conservation, growing environmental concerns and fears about the safety of the nuclear power industry. Expected increases in electric demand never materialized. But the new generation capacity, planned a decade earlier, did. The era of ever-decreasing electric rates ended abruptly, replaced by regular increases.
Brian Hayes
Some utilities, with few plants under construction, weathered this period with relatively minor rate increases. But neighboring utilities that had the misfortune of having too many plants under construction, particularly nuclear plants, saw their costs and their rates skyrocket. For retail power consumers, the result was a growing disparity in electric prices. Meanwhile Congress was pressured to respond to political concerns, including U.S. dependence on foreign oil and interest in alternative generation technologies. The result was the Public Utility Regulatory Policies Act of 1978 (PURPA). PURPA mandated that each investor-owned utility had to purchase power at its avoided cost from a new class of generators, known as qualifying facilities, located in its service territory. These nonutility generators had to meet certain ownership, operating and efficiency criteria. The implementation of PURPA was left to the individual states, resulting in nonuniform definitions of avoided costs. The new players could only sell to the local utility at rates controlled by the regulators. PURPA therefore introduced competition into the generation end of the industry but did not dismantle the system of investor-owned utilities.
The opening of the rest of the industry to competition is taking place as a result of the Federal Power Act of 1992, and Orders 888 (Promoting Wholesale Competition Through Open Access, Nondiscriminatory Transmission Services by Public Utilities) and 889 (Open Access Same-Time Information System) issued by the U.S. Federal Energy Regulatory Commission (FERC). The aim of these changes was simple: to provide nondiscriminatory access to the high-voltage transmission system so as to open the grid to true competition in the generation market. That is, the transmission-owning utilities now must treat power from other generators the same way they treat their own power. The goal of these changes has been to develop bulk electricity markets, providing customers with their choice of electricity supplier. This is certainly more easily said than done.
The electricity market has some features in common with just about any other market. First, there is a product: electric power supplied at the desired voltage level and frequency. Second, there are sellers. Reality is complex, but for simplicity we can think of them as independent generators, each capable of making at least some of our electric energy product. Third, there are buyers. Sweeping a lot of individual variations under the rug, engineers refer to consumers or groups of consumers as electric loads, each requiring a specified amount of the electric power product. Fourth, there is the transportation system that moves the product from the buyers to the sellers, the electrical transmission grid.
But the nature of the product imposes some very unusual rules on this market. For starters, there is no way to realistically store our electric power product. As a parent of young children I am quite familiar with the ability of AA batteries to make toys squeak and talk for hours on end, but power storage is rarely feasible on a larger scale. For all practical purposes, the total amount of our electricity product produced by the generators must at all times be equal to the amount consumed by the loads, plus any losses incurred in the transmission system. Thus the electric grid represents the ultimate in "just in time" manufacturing. Capable of moving at almost the speed of light, the product is always delivered to the customers fresh, within milliseconds of being "manufactured" by the generators.
Another unique rule is that the customers are in complete control of the amount of the product they use. After all, they control the light switch. They never get placed on hold, are never told the product is on order and are never told there is no room at the inn. So the generators must continually match the load, even though daily fluctuations in demand of more than 100 percent are not uncommon.
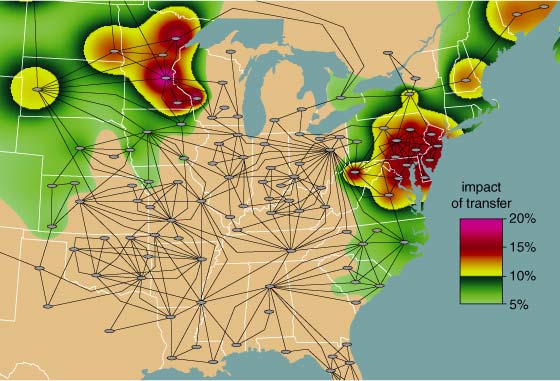
In addition, with few exceptions, there are no mechanisms to control how the product flows through the transmission system from the generators to the load. No valves can change the flow of electricity down a particular line (short of cutting it off entirely with a circuit breaker). Our electricity product does not check a map to determine the shortest route. Rather, electric power flows through the grid as dictated by the impedances of the transmission lines and the locations where electric power is injected by the generators and removed by the loads. This effect is called "loop flow." Because of loop flow a single shipment of power may actually spread throughout a large portion of the grid, changing the flows on a large number of lines. Figure 5 shows how a transmission of power from Wisconsin to Florida would affect power lines as far away as Minnesota (even though that is in the opposite direction!) and Louisiana.
Thomas Overbye and Aaron Cox
Figure 6 illustrates a simple hypothetical transfer between two utilities. In the left part of the figure, two utilities called Left and Right are operating in a mode that involves no net transfer of power. The two lines at the top are conveying 47 megawatts and 12 megawatts of power from Right to Left, while a line at the bottom is conveying 59 megawatts from Left to Right.
Now suppose that Left and Right sign a contract for Left to deliver 150 megawatts of power to Right. This is not a matter of "sending" more electricity flow along one of the lines. The only thing that the utilities control directly are their generators. The right-hand part of the figure shows how Left and Right can accomplish the transfer. Note that the transfer affects every transmission line in the system. If one of the lines had been pushed past its capacity (shown by the pie charts), then the transfer might not even have been possible—with consequences we shall see below.
A final peculiarity of the electric transmission grid is that its available transfer capacity (ATC) is often difficult to quantify. As the Left-Right example suggests, ATC is directly dependent on the current or assumed system operating conditions. But since the electric load is constantly changing, and some transmission lines and generators are always out of service for some reason, the ATC constantly varies. Most of the transmission network consists of wires hanging on big tall towers, taking their share of hits from the weather. Thus the determination of ATC requires considering not just one particular operating condition but rather a large set of plausible contingent operating conditions. A typical ATC study requires studying the set of all contingent states with one line or generator out of service. Finally, transfer-capacity values are dependent on a number of constraints, including the need to avoid exceeding transmission or transformer thermal limits and voltage limits. Any element that exceeds its limit is said to be congested. The ATC value is determined when the first element hits its limit in either the base case or one of the contingent cases.
Once a set of ATC values has been determined, it must be updated any time a new transfer takes place in any direction. One of the consequences of loop flow is that a new power transfer in one direction affects the remaining capacity for making transfers in other directions. For an analogy, imagine that making a reservation on airline A's flight from Chicago to Atlanta changes the number of available seats on every other flight by every airline in the eastern part of North America. Furthermore, determining the new number of available seats requires calculations that can easily generate 100 gigabytes of data!
FERC Orders 888 and 889 provided the broad guidelines for opening the U.S. power industry to competition. How best to achieve this restructuring was left to the individual state governments. Given the divergent political views of the states and the differences in their average electric rates, it should not come as too much of a surprise that restructuring is progressing at vastly different rates across the country. (Nearly 40 percent of the nation's population now lives in states where there is competition.) States such as California, with high electric rates, a strong environmental movement and plentiful alternative sources of power, have been the first to jump on the bandwagon. Other states are finding it difficult to see any advantage to changing the status quo. Regional differences also come from the grid itself; the Eastern Interconnect is highly meshed with lots of relatively short transmission lines, whereas the Western system is dominated by long transmission lines, supplying power from distant generation to load centers primarily situated along the Pacific rim.
Thomas Overbye and Aaron Cox
The result has been a vast diversity of market structures. In many states it is now possible for retail customers to shop for electric service from a variety of suppliers, but in others the local vertically integrated utility is still the only game in town. In a bid to ensure open and fair access by all to the transmission system, in Order 888 FERC envisioned the establishment of several regionwide entities known as ISOs, or Independent System Operators. The purpose of the ISO is to replace the local utility's operation of the grid by a private, not-for-profit organization with no financial interest in the economic performance of any market players. In short, the job of the ISO is to keep the lights on, staying independent of and therefore impartial to the market players. As of the end of 1999 ISOs were operating the electrical grid in California, New England, New York, Texas and the coordinated power market known as PJM (Pennsylvania–New Jersey–Maryland). An ISO covering parts of at least 11 states in the Midwest has been approved by FERC but has not yet begun operation.
In theory, under the benevolent gaze of the ISO, buyers and sellers find each other either through private contracts or through the use of a spot market. This brave new world is being accomplished by a disaggregation of the vertically integrated utility. The generators are being sold, the transmission system is now controlled by the ISO, and customers at each level are free to buy from competitors. The only natural monopoly that remains are the distribution wires themselves. The previously captive retail customer can now either contract directly with a generation company, buy on the spot market or sign up with a "load aggregator," a company that signs up many customers to act as a buying bloc. For many the bottom line will be lower.
But beware: The old cost-plus business is rapidly vanishing, being replaced by one with market-driven electricity prices. The new unregulated generation companies are now free to charge whatever price the market will bear. If the power demand is low or moderate, this results in a market with lots of generators competing for the same load, resulting in low prices. In fact, the spot-market price can go to zero, resulting in free electricity. But when the load climbs, so do the prices, often with breathtaking speed. The underlying physics of the system is unchanged, but the new open market means customers at various levels may begin to feel the impact of those physical laws in the form of price fluctuations.
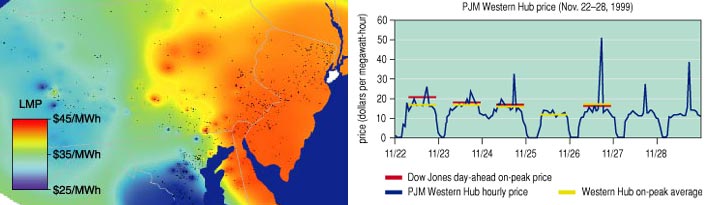
An example is given in Figure 8, which illustrates the marginal prices of electricity at locations throughout Pennsylvania, New Jersey and Maryland at 6 p.m. on July 19, 1999. The marginal price reflects what you would pay for an extra unit of energy consumption, for example when you turn on your air conditioner. The same map would show little variation under low-load conditions; however, as congestion begins to take place on a hot, high-load day, the cost of delivering more power to some regions grows disproportionately. In the same centrally dispatched area, spot-market prices actually fell to zero during a typical low-load week in the fall.
A particularly extreme example of the new sensitivity of prices occurred during the latter part of June 1998. For several days, spot-market prices for electricity in the Midwest experienced almost unheard-of volatility, soaring from typical values of about $25 per megawatt-hour (2.5 cents per kilowatt-hour) up to $ 7,500 per megawatt-hour ($7.50 per kilowatt-hour). Because the affected utilities were selling the power to their customers at fixed rates of less than 10 cents per kilowatt-hour, they lost a lot of money very quickly.
The run-up in prices was so staggering that it might take an everyday analogy to appreciate it. In the 1970s, drivers howled when the price of gasoline tripled. Imagine your consternation if, one day, you pulled into a gas station and discovered the price had increased three hundredfold, from $1.50 per gallon to $450 per gallon. Most of us would look for alternative transportation. But with electricity you do not have options. With no way to store it, the affected utilities had a choice of either paying the going rate, or pulling the plug on their customers on the hottest day of the year. The total additional charges incurred by the utilities as a result of the price spike were estimated to be $500 million.
Although the causes of this volatility are complex, they essentially reflect the underlying characteristics of the electric grid. During the June 1998 price spike, load levels were at or near record levels in the Midwest. As the load went up with no way to store electricity, generation became an increasingly valuable commodity. Recognizing this, companies with generation available to sell were able to raise their prices accordingly.
Interestingly, while generation was in short supply in the Midwest, it was available elsewhere on the grid. However, because of congestion arising from thermal limits on just two elements—a transmission line in Northwest Wisconsin and a transformer in Southeast Ohio—no additional power could be transferred into the Midwest from either the West or the East. The reason for this was loop flow. For example, as Figure 7 shows, a power transfer from Pennsylvania to Illinois would have required that some of the power travel through the congested transformer in Ohio, increasing its overload. Therefore the transfer was not allowed to take place. The overload on this single transformer in Ohio actually prevented utilities from as far away as South Carolina from selling to the affected utilities in Illinois and Wisconsin. This situation allowed the remaining suppliers of power to raise prices to unheard-of levels.
This should not be construed as price gouging on the part of the suppliers: Spot prices 100 times costs may raise eyebrows, but Figure 9 shows why, in the presence of congestion, the fair market value of electricity can be higher than the cost of generation at any of the individual generators. Efficiently managing electricity markets, when congestion on a single element can have such a tremendous systemwide impact, will continue to be a significant challenge for the ISOs.
From the retail customer's point of view, the most noticeable kind of volatility is not measured in dollars and cents, but in minutes and hours: the time spent without electricity during a blackout. During the summer of 1999, the Eastern Interconnect experienced several blackouts or "reliability events" (for example, unexpected voltage drops) affecting as many as 200,000 people at a time. These all happened during unusual heat waves, so high demand was obviously a factor behind the events. But the DOE Power Outage Study Team concluded that the market pressures of deregulation also played a significant role. "Market rules for system operation during times of system emergencies have not been fully developed or agreed upon by market participants," the report concluded.
One of the key goals of deregulation is to obtain lower prices through competition. However, as the grid is deregulated, there are significant concerns that the benefits gained from breaking up the vertical market power of a traditional utility may be lost through the establishment of horizontal market power, particularly in generation markets. Market power is the ability of a particular seller or group of sellers to maintain prices profitably above competitive levels for a significant period of time, and it is the antithesis of competition.
As Figures 7 and 8 showed, limitations on any part of the transmission system can segment large portions of the generation market. The same limitations can give unusual market power to a particular generator. Imagine that a particular bus is joined to the rest of the electric system by a single transmission line. When that line is congested, any additional demand can be handled only by the generator on the local bus. Thus, when the customers turn on their air conditioners on a hot summer day—creating an additional demand—they have no choice but to pay the price set by the local generator. That generator has market power.
Even when the local bus is connected to the rest of the network by several lines, it is easy to devise scenarios where the local generator can gain market power when one of them is congested. This fact creates the possibility that owners of groups of generators could deliberately induce congestion for strategic purposes.
Small generators strategically placed can suddenly have tremendous market power. Under high-load conditions, a single small generator in the western part of New York state producing 85 megawatts—a tiny piece of the state's 25,000-megawatt generating capacity—has a tremendous amount of market power in its region. If that generator were turned off, the marginal price of electricity would spike locally from $25 per megawatt-hour to over $100. Such a large rise in the locational marginal prices comes about because other generators must be dispatched nonoptimally to cope with the congestion.
Under these loading conditions, the small generator in New York has become what is known as a "must-run" generator. A must-run generator is simply one that, for certain system load conditions, must be dispatched within a certain range to prevent transmission-line overloads or other system problems. Keeping in mind that the transmission grid was originally designed to meet the needs of a vertically integrated utility moving power from its generators to its loads, the presence of numerous must-run units is not surprising. Must-run generators exist in most electricity markets.
Must-run generators can be dealt with in several ways, none of which is perfect. One approach is to negotiate long-term contracts for their energy output. This approach works well if a relatively small number of generators fall into this category; however, if there are too many the market is no longer competitive. The long-term contract approach also does not address the issue that almost any generator, during an unexpected power outage, can become temporarily must-run.
To remedy these problems, the ISO can dynamically determine must-run generators. The bids for these generators are then capped to values negotiated in advance. But then the difficulty lies in determining which generators are must-run. If a single entity owns a large portion of the generation within a particular region, it may be able to subtly increase prices above competitive levels. Evidence from simulations suggests that in such situations exploitation of market power by the participants could be expected. On the other hand, the end users of power are now direct players with influence in the market as well.
One reason that markets within the electric-power industry can be so volatile is that they are, for the most part, one-sided. The real-time electricity prices that I have quoted above are not being passed on to the end users. Therefore the end users have little incentive to modify their electricity usage. During the June 1998 Midwestern price spike, the customers of the affected utilities paid the same rates as they did the week before, when the spot market prices were more than a hundred times lower. The utilities made urgent pleas to their customers to conserve, and many did, but not because they saw the high prices. If customers had known about them—and especially if they had been forced to pay them—it is likely that the load and hence the spot market prices would have been substantially less.
Currently a small portion of the load is, at least indirectly, price-sensitive. For a long time utilities have provided some of their industrial customers with lower rates, provided the customers agree to allow the utility to turn off their electricity at specified times of year for an agreed-upon duration. These are known as interruptible rates. Interruptible rates have worked well, but only for customers that either have alternative sources of electricity, such as their own backup generators, or that can completely turn off equipment that uses lots of electricity. More direct control of load has been accomplished through demand-side management programs. These reduce the peak demand for electricity, either by promoting conservation or by enabling the utility to turn off certain residential loads, such as water heaters or air conditioners. All of these programs have been beneficial in reducing the peak loads but have not involved direct price feedback to customers.
As customer choice emerges, real-time pricing for end users will probably be one of the options load aggregators use to compete for customers. For the load aggregators, real-time pricing will lessen their risks in obtaining electricity on the spot market. For customers with more flexible electricity requirements, real-time pricing should result in lower overall electricity bills, because most of the time these customers will be able to obtain electricity at lower spot-market prices.
Brian Hayes
Of course, if there are price spikes, customers seeing real-time prices will have to be able to adjust their electric demand. This may require some changes in life-style. Although nobody wants to have to check the price meter to determine whether or not electric rates are low enough to watch a favorite TV program or to microwave a bag of popcorn, not all kilowatt-hours have such high value. Perceived value per kilowatt-hour varies tremendously. For example, operating a portable computer for a day might take on the order of 1 kilowatt-hour. Even during a price spike of $7,500 per megawatt-hour, I might be willing to pay the $7.50 it costs to run my computer for the day or the pennies it would take to keep the VCR clock from resetting. But the air-conditioner thermostat would certainly get turned up a few degrees, the wash might not get done, and dinner would probably not involve a roast turkey. With new technologies, many of these demand changes could be set up to take place automatically. Real-time pricing might also spur the development of better solutions for short-term (several hours) energy storage.
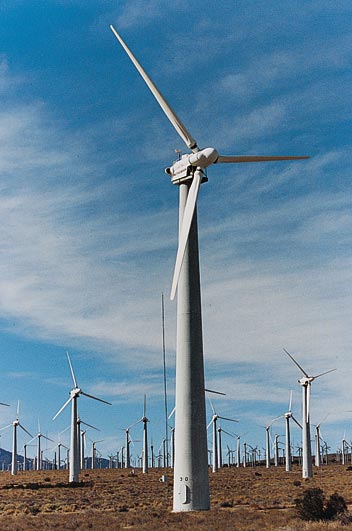
Consumer choice is already driving many changes in the industry. For instance, a growing number of utilities offer a "green" energy supply package. Previously, renewable sources such as wind and geothermal energy were not as economical as the more traditional fossil fuel and nuclear sources. Even if they were so inclined, regulated utilities could not justify passing on the higher costs to all their customers. But with deregulation, customers who are willing to pay a premium for green power are now able to do so.
For example, customers of Madison Gas and Electric (MGE), headquartered in Madison, Wisconsin, can elect to purchase some or all of their electricity from MGE's new wind farm. MGE customers wishing to support wind power pay an extra 3.33 cents per kilowatt-hour, an increase of about 40 percent over their regular rates. (Of course, once wind-generated power is injected into the grid it is no different from any other power.) So many customers have signed up that new customers wanting wind energy now have to be placed on a waiting list. Throughout the country, at least 60 utilities offer or plan to offer green power options.
Over the long term, new generation methods will certainly mitigate the exercise of market power. The combination of new combined-cycle, gas turbine technology and the deregulation of natural gas prices have significantly reduced the economies of scale in power generation. Now, cost-competitive generators can be built in a fraction of the time it used to take to build the large coal or nuclear generators, and their smaller size allows much greater flexibility in siting. The result has been an explosion of applications for new generation. For example, PJM, with an installed capacity of about 56,000 megawatts, has seen new generation applications for over 30,000 megawatts. Although a significant portion of this generation will never be built, the portion that is built is sure to have an impact.
Finally, in an ironic twist, the electric industry may be moving back to where it began in the 1880s, with small generators supplying a handful of customers. Two promising technologies for "distributed generation," in which the generator is located at or near the load, are microturbines and fuel cells. A microturbine is a small natural-gas fueled combustion turbine with an integrated high-speed generator. Microturbines may not be small enough for residential use, but they could certainly meet the needs of commercial establishments. Fuel cells are similar to batteries, in that electricity is created via a chemical process. However, unlike a battery, the fuel cell includes a fuel input and therefore does not run down. Fuel cells for home use are already available, and they are under active development as a low-emission energy source for cars. If the economies are right, the family car may even be used to light up your house! With real-time pricing, it is not hard to imagine a microprocessor that switches on the car for electricity any time the price from the grid gets too high.
Like it or not, the days of the vertically regulated electric utility will soon be gone for good. Will the deregulated future hold lower rates? Certainly for some, but not necessarily for all. Moreover, as our phones begin to ring and our mailboxes begin to fill with solicitations for electric service, it will quickly become apparent that uncomplicated electric rates are also gone for good. With the freedom to choose comes the obligation to choose. So choose wisely!
Click "American Scientist" to access home page
American Scientist Comments and Discussion
To discuss our articles or comment on them, please share them and tag American Scientist on social media platforms. Here are links to our profiles on Twitter, Facebook, and LinkedIn.
If we re-share your post, we will moderate comments/discussion following our comments policy.