The Robot Ocean Network
By Oscar Schofield, Scott Glenn, Mark Moline
Automated underwater vehicles go where people cannot, filling in crucial details about weather, ecosystems, and Earth’s changing climate.
Automated underwater vehicles go where people cannot, filling in crucial details about weather, ecosystems, and Earth’s changing climate.

DOI: 10.1511/2013.105.434
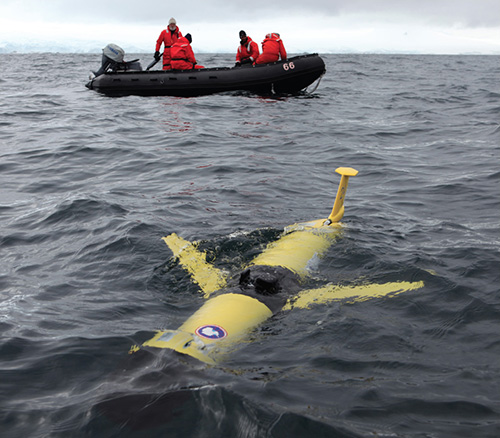
In the frigid waters off Antarctica, a team of our colleagues deploy a waterborne robot and conduct final wireless checks on the system’s internal engines and onboard sensors, before sending the device on its way to explore the ocean conditions in an undersea canyon over a month-long expedition. The autonomous robot’s mission will be monitored and adjusted on the fly by scientists and their students remotely located in the United States; the data it returns will become part of our overall picture of conditions in the Southern Ocean.
Photograph courtesy of Jason Orfanon
Ocean robots—more formally known as autonomous underwater vehicles, or AUVs—are improving our understanding of how the world’s ocean works and expanding our ability to conduct science at sea even under the most hostile conditions. Such research is essential, now more than ever. The ocean drives the planet’s climate and chemistry, supports ecosystems of unprecedented diversity, and harbors abundant natural resources. This richness has lead to centuries of exploration, yet despite a glorious history of discovery and adventure, the ocean remains relatively unknown. Many basic and fundamental questions remain: How biologically productive are the oceans? What processes dominate mixing between water layers? What is its total biodiversity? How does it influence the Earth’s atmosphere? How is it changing and what are the consequences for human society?
The last question is particularly pressing, as many observations suggest that significant change is occurring right now. These shifts reflect both natural cycles and, increasingly, human activity, on a local and global scale. Local effects include alterations in circulation, increased introduction of nutrients and pollutants to the sea, the global transport of invasive species, and altered food web dynamics due to the overexploitation of commercially valuable fish species. Regional- and global-scale changes include altered physical (temperature, salinity, sea-level height), chemical (oxygen, pH, nutrients), and biological properties (fishing out of top predators).
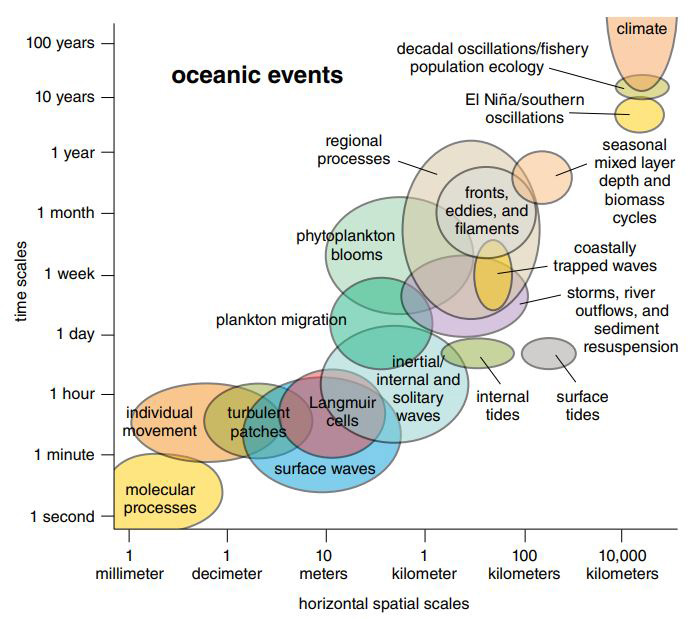
Addressing the many unknowns about the ocean requires knowledge of its physics, geology, chemistry, and biology. On the most basic level, one has to be able to track the movement of water and its constituents over time to understand physical transport processes. But this fundamental first step remains a difficult problem given the three- dimensional structure of the ocean and the limited sampling capabilities of traditional oceanographic tools. About 71 percent of the world is covered by the ocean, with a volume of about 1.3 billion cubic kilometers. Only about 5 percent of that expanse has been explored. A further complication is the broad scale of ocean mixing—spatially, from centimeters to thousands of kilometers, and temporally, from minutes to decades. These processes are all modified by the interactions of currents with coastal boundaries and the seafloor.
Adapted by Tom Dunne from an illustration by Tommy Dickey
If the problem of monitoring mixing can be solved, then focus can shift to the biological and chemical transformations that occur within the water. Factors that remain unknown include the amount of inorganic carbon being incorporated into organic carbon, and how quickly that organic matter is being transformed back into inorganic compounds—processes that are driven by marine food webs. Many of these transformation processes reflect the “history” of the water mass: where it has been and when it was last mixed away from the ocean surface. Because of the vast domain of the ocean, our ability to sample the relevant spatial and temporal scales has been limited.
Oceanographers usually collect data from ships during cruises that last days to a few months at most. The modern era of ship-based expeditionary research, launched just over a century ago, has resulted in major advances in our knowledge of the global ocean. But most ships do not travel much faster than a bicycle and they face harsh, often dangerous conditions. The high price of ships also limits how many are available for research. A moderately large modern research vessel may run about $50,000 a day even before the costs of the science. Ocean exploration requires transit to remote locations, a significant time investment. Once on site, wind and waves will influence when work can be safely conducted.
For example, one of us (Schofield) routinely works along the western Antarctic Peninsula. The travel time from New Jersey to the beginning of experimental work can take upward of a week: two days of air and land travel, one to two days of port operations, and four days of ship travel. During the writing of this article, Schofield was at sea offshore of Antarctica, where ship operations were halted for several days due to heavy winds, waves, and icy decks. All three of us have on multiple occasions experienced the “robust” work atmosphere— such as broken bones and lacerations—associated with working aboard ships. Despite these difficulties, ships are the central tool for oceanography, providing the best platform to put humans in the field to explore. But researchers realized decades ago that they needed to expand the ways they could collect data at sea.
Satellites provide a useful sampling tool to complement ships and can provide global estimates of surface temperature, salinity, sea surface height, and plant biomass. Their spatial resolution, however, is relatively low (kilometers to hundreds of kilometers), and they often cannot collect data in cloudy weather. Additionally, they are incapable of probing the ocean interior. Ocean moorings (a vertical array of instruments anchored to the seafloor) can provide a time series of measurements at single points, but their high cost (ranging from $200,000 to millions each) limits their numbers.
Twenty-three years ago, those challenges inspired oceanographer Henry “Hank” Stommel to propose a globally distributed network of mobile sensors capable of giving a clearer look, on multiple time and space scales, at the processes going on in the world’s ocean. His futuristic vision is finally becoming a reality. Thousands of robots are today moving through the world’s ocean and communicating data back to shore. They provide crucial information on everything from basic processes— such as the ocean’s temperature and salinity—to specific processes like storm dynamics and climate change.
The most vital component of the rapidly growing ocean sensor network is the AUV. These devices come in various types, carry a wide variety of sensors, and can operate for months at a time with little human guidance, even under harsh conditions.
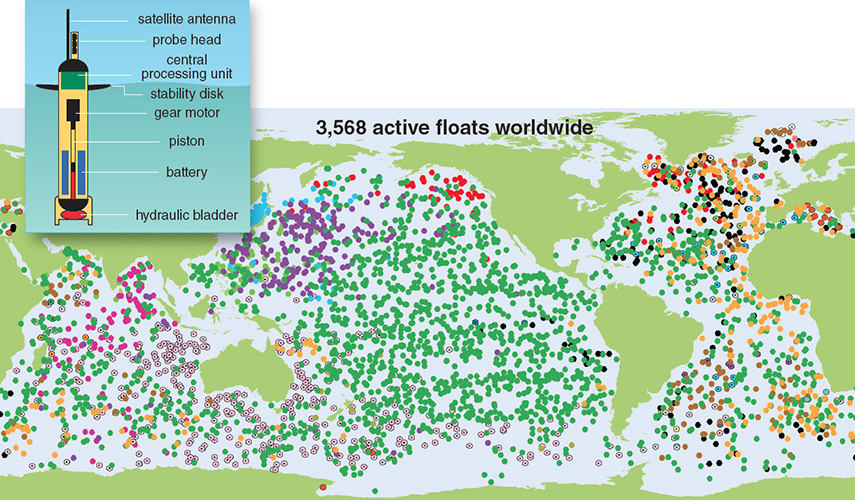
Illustration by Tom Dunne.
Underwater robotics has made major advances over the past decade. Key technological gains include an affordable global telecommunication network that provides sufficient bandwidth to download data and remotely control AUVs from anywhere on the planet, the miniaturization of electronics and development of compact sensors, improved batteries, and the maturation of platforms capable of conducting a wide range of missions.
The AUVs being used in the ocean today generally come in three flavors: profiling floats, buoyancy-driven gliders, and propeller vehicles. In the first category, the international Argo program has deployed more than 3,500 relatively inexpensive profiling floats (costing about $15,000 each) throughout the ocean, creating the world’s most extensive autonomous ocean network. These 1.3-meter-long platforms decrease their buoyancy by pumping in water, sinking themselves to a specified depth (often more than 1,000 meters), where they remain for about 10 days, drifting with the currents. The floats then increase their buoyancy by pumping out water, and rise to the surface. During the descent and ascent, onboard sensors collect vertical profiles of ocean properties (such as temperature, salinity, and a handful of ocean color and fluorescence measurements). New chemical sensors to measure pH and nutrients are also available. Data are transferred back to shore via a global satellite phone call. After transferring the data, the floats repeat the cycle.
Profiling floats are incapable of independent horizontal travel, leaving their movements at the mercy of the currents, but they are extremely efficient. A single battery pack can keep a float operating for four to six years. The combined data from large numbers of floats provides great scientific value, offering a comprehensive picture of conditions in the upper 1,000 meters of the ocean around the globe. When these data are combined with global satellite measurements of sea-surface height and temperature, they allow scientists to observe for the first time climate-related ocean variability in temperature, salinity, and circulation over global scales.
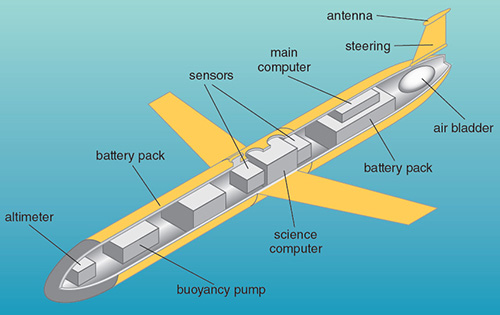
Illustration by Tom Dunne.
Cousin to the profiling floats are the buoyancy-driven gliders, which were highlighted in Stommel’s original vision of a networked ocean. Several different types exist, but generally they are 1 to 2 meters long and maneuver up and down through the water column at a forward speed of 20 to 30 centimeters per second in a sawtooth-shaped gliding trajectory. They operate by means of a buoyancy change similar to that for floats, but wings redirect the vertical sinking motion due to gravity into forward movement. A tailfin rudder provides steering as the glider descends and ascends its way through the ocean, which makes these devices more controllable than the floats. They are more expensive, however, costing around $125,000. Therefore, they are often deployed for specific scientific missions.
A glider’s navigation system includes an onboard GPS receiver coupled with an attitude sensor, a depth sensor, and an altimeter. The vehicle uses this equipment to perform dead reckoning navigation, where current position is calculated using a previously determined position, and that position is then updated based on known or estimated speeds over elapsed time and course. Scientists can also use a buoyancy-driven glider’s altimeter and depth sensor to program the location of sampling in the water column. At predetermined intervals, the vehicle sits on the surface and raises an antenna out of the water to retrieve its position via GPS, transmit data to shore, and check for any changes to the mission.
Because their motion is driven by buoyancy, the gliders’ power consumption is low. They can coast for up to year on battery power. These robots are also modular: Researchers can attach sensors customized to one particular science mission, and then remotely reprogram what the sensors are searching for in near real time, based on collected data.
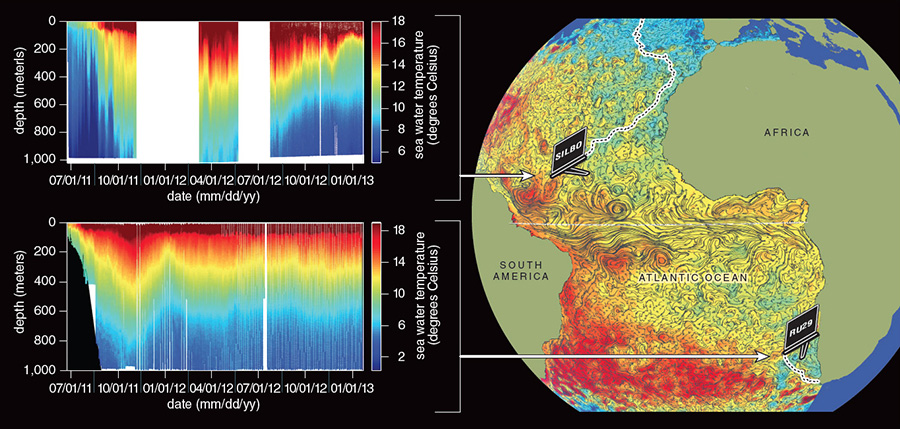
Images courtesy of the authors.
The most advanced, but also the most expensive, underwater robots are the propeller-driven AUVs. Costs can range from $50,000 to $5 million, depending on the size and depth rating of the AUV. They are powered by batteries or fuel cells, and can operate in water as deep as 6,000 meters. Like gliders on the surface, propeller AUVs receive a GPS fix and relay data and mission information to shore via satellite. While they are underwater, propeller AUVs navigate by various means. They can operate inside a network of acoustic beacons, by their position relative to a surface reference ship, or by an inertial navigation system, which measures the vehicle’s acceleration with an accelerometer and orientation with a gyroscope. Travel speed is determined using Doppler velocity technology, which measures an acoustic shift in the sound waves that the vehicle bounces off the seafloor or other fixed objects. A pressure sensor measures vertical position.
Propeller-driven AUVs, unlike gliders, can move against most currents at 5 to 10 kilometers per hour, so they can systematically measure a particular line, area, or volume. This ability is particularly important for surveys of the ocean bottom and for operations near the coastline in areas with heavy traffic of ships and small crafts.
Most AUVs in use today are powered by rechargeable batteries (such as lithium ion ones similar to those in laptop computers). Their endurance depends on the size of the vehicle as well as its power consumption, but typically ranges from 6 to 75 hours of operation under a single charge, with travel distances of 70 to 400 kilometers over that period. The sensor cargo they carry also depends on the size of the vehicle and its battery capacity.
Because of the additional power of propeller AUVs compared to gliders, they can run numerous sensor suites, and they remain the primary autonomous platform for sensor development. Hundreds of different propeller AUVs have been designed over the past 20 or so years, ranging in size from 0.5 to 7 meters in length and 0.15 to 1 meter in diameter. Most of these vehicles have been developed for military applications, with a few operated within the academic community. By the end of this decade, it is likely that propeller AUVs will be a standard tool used by most oceanographic laboratories and government agencies responsible for mapping and monitoring marine systems.
Together, the three types of ocean robots deployed throughout the world’s ocean are bringing into scientific reach processes that are not accessible using ships or satellites. For example, these robots can study the ocean’s response to, and feedback from, large storms such as hurricanes and typhoons. All three of us live in the mid-Atlantic region of the United States and have experienced Hurricanes Irene and Sandy, so we are all too familiar with storm aftermath in our local communities.
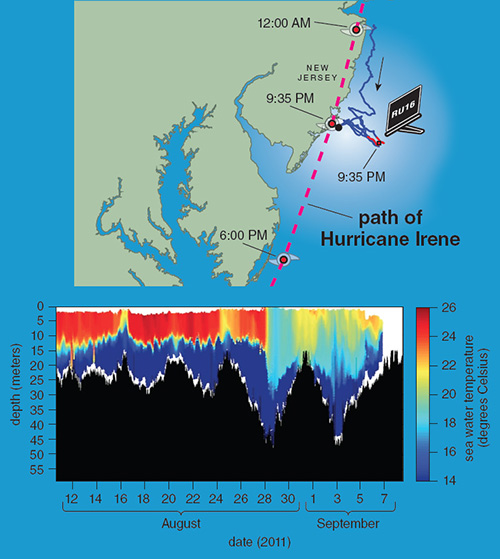
Images courtesy of the authors.
Hurricane Irene, a category-1 storm offshore, moved rapidly northward along the U.S. East Coast in August 2011, resulting in torrential rains and significant flooding on inland waterways. Hurricane Sandy, a much larger category-2 storm offshore, made an uncharacteristic left turn and approached perpendicular to the coast in October 2012, causing significant damage to coastal communities. The U.S. National Hurricane Center ranks Sandy as the second-costliest hurricane ever in this country, producing over $60 billion of damage; Irene comes in eighth place, with at least $15 billion in damages.
Path forecasts by the U.S. National Hurricane Center for Irene and Sandy were extremely accurate even several days in advance, enabling evacuations that saved many lives. Hurricane intensity forecasts were less precise. The force of Irene was significantly overpredicted, and the rapid acceleration and strengthening of Sandy just before landfall was underpredicted. A more accurate forecast for Sandy would have triggered more effective preparations, which might have reduced the amount of damage.
The cause of the discrepancy between track forecasts and intensity forecasts remains an open research question. Global atmospheric model development over the past 20 years has successfully reduced forecast hurricane track errors by factors of two to three. The predictive skill of hurricane intensity forecasts has remained flat, however.
One possible reason is that more information is required about the interactions between the ocean and the atmosphere during storms, because the heat content of the upper ocean provides fuel for hurricanes. The expanding array of robotic ocean-observing technologies is providing a means for us to study storm interactions in the coastal ocean just before landfall, accessing information in ways not possible using traditional oceanographic sampling.
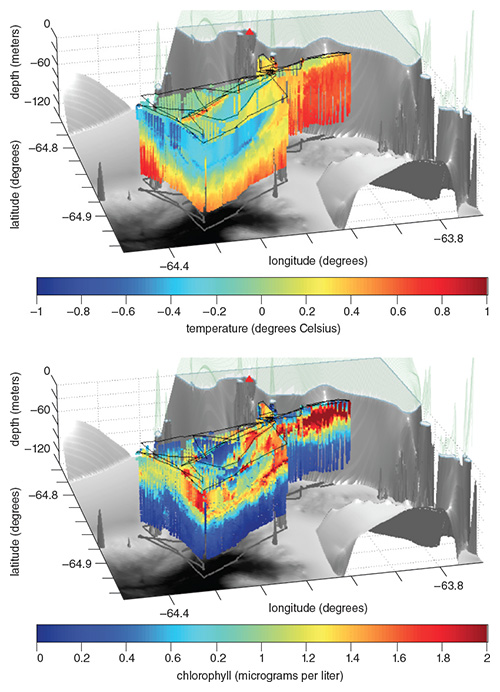
Images courtesy of the authors.
During the summer, the surface waters of the mid-Atlantic are divided into a thin, warm upper layer (10 to 20 meters deep and 24 to 26 degrees Celsius) overlying much colder bottom water (8 to 10 degrees). Gliders were navigating the ocean waters beneath both Hurricanes Irene and Sandy, collecting hydrographic profiles. Data taken during Irene suggest that as the leading edge of the storm approached the coast, the hurricane-induced increase in the flow of water onto the shore was compensated by an offshore flow below the thermocline (the region of maximum temperature change in the water column) in a downwelling flow created by high winds. This phenomenon minimized the potential storm surge. Simultaneously, storm-induced mixing of the water layers broadened the thermocline and cooled the ocean surface ahead of Irene by up to 8 degrees in a few hours, shortly before the eye of the storm passed over. This cold bottom water potentially weakened the storm as it came ashore. When data from a glider that measured the colder surface water were retrospectively input into the storm forecast models, that adjustment eliminated the overprediction of Irene’s intensity.
In contrast to Irene, Hurricane Sandy arrived in the late fall, after seasonal cooling had already decreased the ocean surface temperatures by 8 degrees. As the storm came ashore, it induced mixing of cold water from the bottom to the surface—just as Hurricane Irene did—but because of the seasonal declines in temperature, the surface water temperature dropped by only around 1 degree. Such a small change did little to reduce the intensity of Hurricane Sandy as it approached the New Jersey and New York coastlines.
Robotic platforms have thus demonstrated their potential to sample storms and possibly aid future forecasts of hurricane intensity. The gliders operate effectively under rough ocean conditions that are not safe for people, and the mobility of gliders allows their positions to be adjusted as the storm moves. Their long deployment lifetime means these robots can be in place well before the storm’s arrival until well after conditions calm down. Real-time data from the gliders should improve hurricane intensity forecast models and potentially help coastal communities proactively mitigate storm damage.
As complex as hurricane forecasting may be, it pales in comparison to interpreting changes in ocean physics on a global scale, and then connecting those changes with local effects such as sea ice coverage or species decline.
Many questions oceanographers face are so complex that they require the combined data of several robotic platforms that span the range of spatial and temporal scales of marine ecosystems. Linking global changes to local effects has been difficult to impossible using conventional strategies.
One setting that illustrates the importance of bridging these scales is the western Antarctic Peninsula, which is undergoing one of the most dramatic climate-induced changes on Earth. This region has experienced a winter atmospheric warming trend during the past half-century that is about 5.4 times the global average (more than 6 degrees Celsius since 1951). The intensification of westerly winds and changing regional atmospheric circulation, some of which likely reflects the effect of human activity, has contributed to increasing transportation of warm offshore circumpolar deep wateronto the continental shelf of the peninsula.
This water derives from the deep offshore waters of the Antarctic Circumpolar Current, the largest ocean current on Earth, and is the primary heat source in the peninsula. The altered positions of this current are implicated in amplifying atmospheric warming and accelerating glacier retreat in the region. Monitoring and tracking the dynamics of the warm offshore deep current require a sustained global presence in the sea, which is now being accomplished via the Argo network of autonomous floats. Data from Argo suggest that the Antarctic Circumpolar Current has exhibited warming trends for decades.
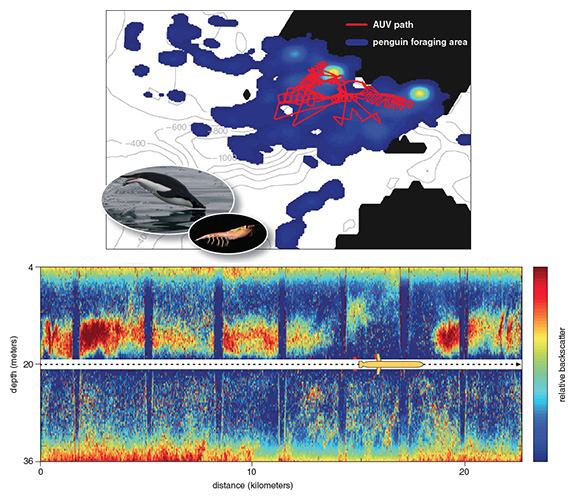
Images courtesy of the authors.
The increased presence and changing nature of the deep-water circulation has implications for the local food web. The Western Antarctic Peninsula is home to large breeding colonies of the Antarctic Adélie penguin (Pygoscelis adeliae), which live in large, localized colonies along the peninsula even though food resources are abundantly available along the entire inner continental shelf. This concentration of the population has raised a persistent question: What turns specific locations into penguin “hot spots?”
The locations of the Adélie colonies appear to be associated with deep seafloor submarine canyons, which are found throughout the continental shelf of the peninsula. This colocation has led to a hypothesis that unique physical and biological processes induced by these canyons produce regions of generally enhanced prey availability. The canyons were also hypothesized to provide recurrent locations for polynyas (areas of open water surrounded by sea ice), giving penguins year-round access to open water for foraging. But linking the regional physical and ecological dynamics to test the canyon hypothesis had been impossible, because brutal environmental conditions limited spatial and temporal sampling by ships.
Robotic AUVs now offer expanding capabilities for observing those conditions. As part of our research, for the past five years we have been using a combination of gliders and propeller AUVs to link the transport of the warm offshore circumpolar deep water to the ecology of the penguins in the colonies. Gliders surveying the larger scale of the continental shelf have documented intrusions of deep, warm water upwelling within the canyons near the breeding penguin colonies. These intrusions of warm water appear to be ephemeral features with an average lifetime of seven days, which is why earlier, infrequent ship-based studies did not effectively document them. Associated with this uplift of circumpolar deep water along the slope of the coastal canyon, the gliders found enhanced concentrations of phytoplankton, providing evidence of a productive food web hot spot capable of supporting the penguin colonies.
Many questions are so complex that they require the combined data of several robotic platforms.
Satellite radio tagging is being used to characterize the foraging dynamics of the Adélie penguin, and has shown the majority of their foraging activity was centered at the slope of the canyon. These more localized foraging patterns were used to guide sampling of the physical and biological properties with a propeller AUV, because strong coastal currents hindered buoyancy-driven gliders. The propeller AUV data were used to generate high-resolution maps, which revealed that penguin foraging was associated with schools of Antarctic krill. The krill in turn were presumably grazing on the phytoplankton at the shelf-slope front.
It took the integration of all three classes of robotic systems (profilers, gliders, and propeller AUVs) to link the dynamics of the outer shelf to the coastal ecology of the penguins. But in the end, that combination of techniques turned out to be just what was needed to settle a long-standing mystery of penguin biogeography. Better understanding of these processes is critical to determining why these penguin populations are exhibiting dramatic declines in number—for example, the colonies located near Palmer Station in Antarctica have declined from about 16,000 to about 2,000 individuals over the past 30 years. Ongoing and future robotic deployment will help address how climate-induced local changes in these deep-sea canyons might underlie the observed declines in the penguin populations, which themselves are serving as a barometer for climate change.
The pace of innovation for ocean technology is accelerating, guaranteeing that the next-generation robotic systems and sensors will make current crusty oceanographers green with envy. Some of that future direction is evident in recent advances such as AUVs with onboard data analysis, so they can make smart decisions at sea by analyzing their own data. Improved sampling will also be achieved by developing methods to coordinate the efforts of multiple AUVs, either by communicating directly among themselves or by downloading commands sent from shore.
These technical advances will dramatically improve our ability to explore the ocean. But the largest effect of these systems is likely to be a cultural shift stemming from real-time, open-access data. Ocean science has historically been limited to a small number of individuals who have access to the ships that can carry them out to sea, but the realization of Hank Stommel’s dream now allows anyone with interest to become involved. This outcome will democratize the ocean sciences and ultimately increase overall ocean literacy, relevant for 71 percent of this planet.
This cultural shift in oceanography comes at a critical time, given that observations suggest that climate change is altering ocean ecosystems. Examining past large-scale changes in the ocean has revealed global scale alterations in the biota of Earth, suggesting life is more intimately linked to the state of the world’s ocean than we knew. The greater our awareness of these intricate connections, the better chance we have of coping with a changing ocean planet.
Update from the authors about the May 2014 catastrophic failure of the robot Nereus:
"The Nereus, one of the few systems capable of deep ocean exploration, likely suffered an implosion during its mission. The Nereus was exploring the deep Kermadec Trench and was working under extremely high pressures, highlighting the difficult operating conditions of the ocean. The technical challenges of working in these regions are numerous and will continue to be a focus of leading technologists around the world. It should be highlighted that there was no loss of human life, exemplifying the important role these robotic technologies play in safe ocean exploration. So despite a setback, we remain undaunted and argue for the accelerated development of new platforms that will help us understand the status and trajectory of this ocean planet. Finally, as field-going oceanographers, we often become emotionally attached to our tools; given this, we tip our caps and toast Nereus’s heroic death at sea.”
–Oscar Schofield, Scott Glenn, and Mark Moline
Click "American Scientist" to access home page
American Scientist Comments and Discussion
To discuss our articles or comment on them, please share them and tag American Scientist on social media platforms. Here are links to our profiles on Twitter, Facebook, and LinkedIn.
If we re-share your post, we will moderate comments/discussion following our comments policy.