Real-time Flood Forecasting
By Chintu Lai, Ting-Kuei Tsay, Chen-Ho Chien, I-Ling Wu
We've learned to predict typhoons. What is required to predict the floods they bring?
We've learned to predict typhoons. What is required to predict the floods they bring?

DOI: 10.1511/2009.77.118
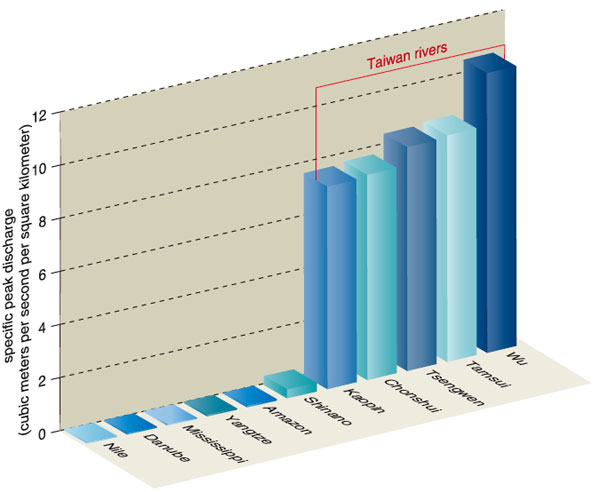
When geography teachers instruct their students about the great rivers of the world, the Amazon, Nile, Yangtze, Mississippi and Yellow usually head the list. Those are truly large rivers, but they earn their distinction by length. From a hydraulic engineer’s perspective, however, neither length nor even total discharge is the most important characteristic.
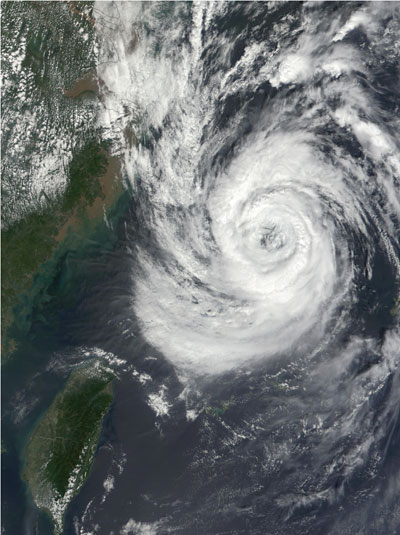
Image courtesy Jacques Descloitres, MODIS Land Rapid Response Team at NASA GSFC.
When it comes to flood control and prediction, peak discharge per unit area of watershed (specific peak discharge) is the essential criterion, because it describes a river’s volatility.
The five rivers that lead in this category may be unfamiliar to you. All are found on the island of Taiwan (Figure 2). The specific peak discharge of the Shinano River in Japan is outsized compared to the other storied rivers, yet it is dwarfed by the river systems of Taiwan. The explanation for their singular flows is relatively simple: Taiwan is very steep and very wet. More than 30 percent of the terrain is mountainous, with elevations above 1,000 meters, and more than 60 percent consists of hills and plateaus 100 meters or more above the remaining plains. In other words, much of the country consists of channels to watersheds. Annual rainfall is 2.5 times the world average at 2,500 millimeters. Most of the rain arrives between May and October, and most of that arrives with typhoons, of which there were 350 in the past century.
Barbara Aulicino
We have become accustomed to accurate weather forecasts, trusting them even several days into the future. If the weather announcer says bring an umbrella on Tuesday, we are wise to listen. In the Pacific region, the weather includes typhoons, and these tropical cyclones bring not just rain but floods. In Taiwan the floods originate in the mountains as huge amounts of water channel toward the river basins. The channels converge in the race to the ocean. The changes in the volumes of flow in just a few moments can be spectacular. Can these flows be predicted? The question is a critical one for the millions of people who live in Taiwan’s lowlands.
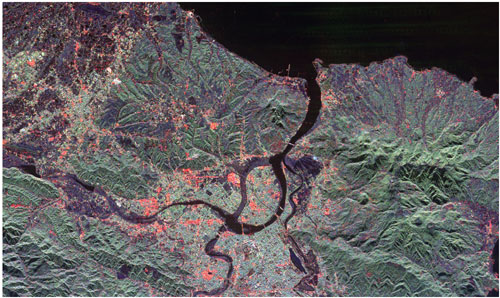
Image courtesy of NASA JPL.
Between 2001 and 2005, we worked on a project to create a real-time flood-forecasting model for complex river systems, with the specific and immediate goal of forecasting the torrents that arrive in the Tamsui River Basin. The Tamsui River system in northern Taiwan is a main geographical and economic artery of the greater metropolitan Taipei area. It has signature features that make it unique, beautiful—and dangerous (Figure 3). We undertook the development and implementation of the real-time forecasting model as members of the Hydroinformatic Research and Development Team (HIRDT) of the National Taiwan University, sponsored by the 10th River Management Bureau of the Water Resources Agency of Taiwan. As we will describe, our efforts were rewarded by gratifyingly accurate results when our model was challenged, barely after we had begun our work, by an epic storm.
There are two approaches to mathematical modeling of complex phenomena. A deterministic model manipulates variables in ways that are numerically explicit—specific parameter values are operated on to produce a discrete result. An example of deterministic modeling would be applying Newton’s laws to determine the precise location of a planet, say Jupiter, at a future point in time. An alternative, stochastic modeling, employs sampling and probabilities to produce answers. Large-scale weather modeling, for example, proceeds by such strategies, averaging the results of several probability models to produce a stochastically derived outcome with an acceptable balance of accuracy versus uncertainty.
The simulation model we developed for the Tamsui River basin was deterministic. The deterministic approach generally entails rather sophisticated and elaborate mathematics, while offering the advantage of rapid calculation, which is required for a real-time forecasting system, and rather precise results, which could prove to be quite important when the time came to sound a warning. An additional advantage is the limited amount of input data required to run the simulation.
The Tamsui River is the third largest river in Taiwan, with its longest limb stretching 159 kilometers. In terms of numerical modeling, the river system presents great complexity. It has large and small tributaries, it branches and rejoins, and the junctions have diverse shapes, angles, and rapidly changing flow patterns and rates.
The Tamsui River collects water from three main tributaries: Tahhan Stream, Hsintian Stream and the Keelung River. It meanders through the Taipei Basin and enters the Taiwan Strait at He-Kou (River Mouth). The upstream regions of the tributaries are marked by steep channels and rapid flows. In the estuary and near coastal areas, however, the Tamsui River is flat and strongly affected by the tides, including daily reversals in the direction of flow. The actual flow of water at the point where the three branches meet can be any imaginable combination of forward and reverse flow.
In the study of river dynamics, flows that exhibit changes over time in stage (water surface elevation), depth, discharge, velocity and so on are known as unsteady flows. There are three basic types of unsteady flows in river channels: tidal, flood and rapidly varied (either naturally occurring or human-induced). All three types can occur at the same time and place in the Tamsui River basin. A useful flood forecast model must be able to incorporate all of this geometrical complexity and intricate flow dynamics in a real-time simulation.
Barbara Aulicino
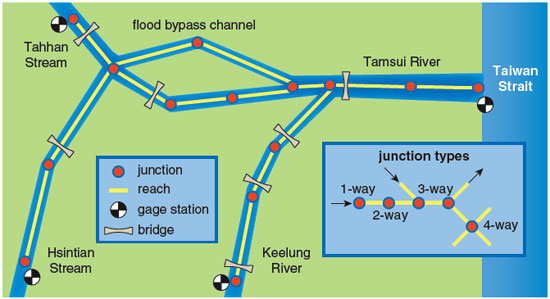
Achieving an accurate simulation begins with a careful study of the geometry of the waterway. The Taipei basin is a compound complex channel (CCC) system that includes dendritic and network channels. To build a simulation model, this natural CCC system must be schematized into a geometrically simplified channel system that can be interpreted by a computer. Figure 4 illustrates how we schematized a section of the Tamsui network by designating junctions and the reaches between them. Junctions may be one-, two-, three- or four-way. A one-way junction is a boundary point—for example, the terminus of a reach at the edge of the simulation region. The other junctions are internal boundary points, for example, the point where two reaches meet in a contiguous line (two-way junction) or where three or more reaches meet at an intersection (inset, Figure 4). For each of the junctions and reaches, an appropriate method must be devised for evaluating mathematically the state of flow in the region. These solutions will ultimately be combined in a simulation of the entire system.
Our schematized framework has two roles. First, it represents the conversion of a general flow model into a site-specific model—in this case, an unsteady flow model of the Tamsui River basin. Second, it identifies a significant portion of the initial input data.
At this point, a review of the principles of predicting unsteady flow is in order. In general terms, unsteady flow in open channels can be described by a specialized set of partial differential equations (PDEs) designed to model fluid motion. In our model, the basic unsteady-flow PDEs are transformed using a technique called the method of characteristics, in which physical quantities are modeled as characteristics, mathematical entities that can be thought of as waves with direction components and the ability to interact. We take this technique further with a recent development called the multimode method of characteristics of the second kind (MMOC-II), designed to facilitate complex flow simulation on the computer. (Readers interested in the more mathematical and mechanistic aspects of this model should see Lai 1986, 1988, 1994 and 1999.) The mathematics in our model has several special features, including the ability to accommodate characteristic waves of greatly different speeds, from very fast to extremely slow, and to keep all characteristic curves in the numerically explicit mode. The ability to compute entirely in the explicit mode allows us to rapidly evaluate unknowns at grid points in our model, one grid point at a time. The alternative, a matrix solution, would need to be very large and would be potentially very troublesome.
A hint of the challenge is given by the types of variables that must be evaluated, including, but by no means limited to, the cross-sectional area of flow, the width at the top of the flow channel, the depth of the flow, its velocity, and so on. This model assumes a fixed bed, removing the need to consider sedimentation and bed deformation. Even simplified however, the analysis of unsteady, open-channel flow remains a difficult challenge for hydraulic engineers.
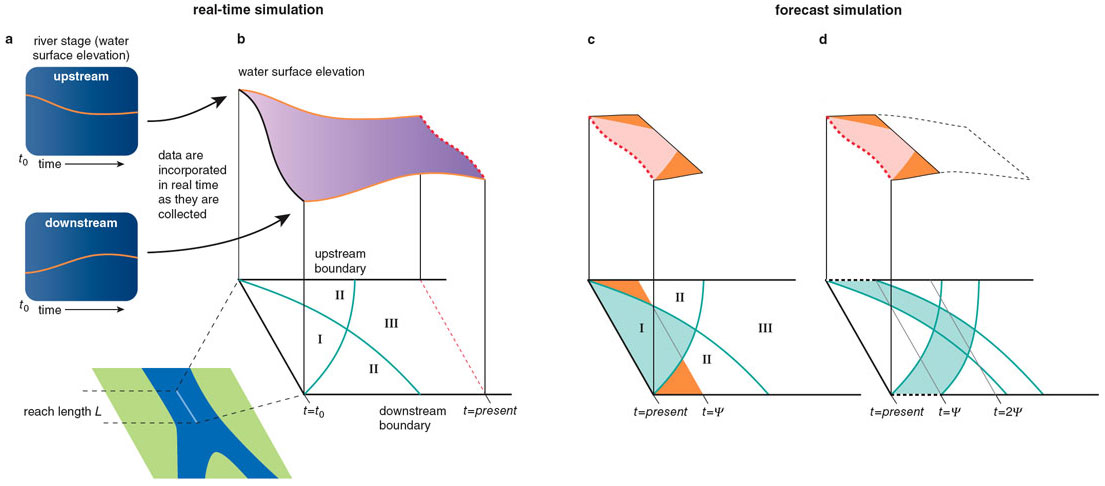
Flow prediction is based on the construction of two models, one that simulates the real-time flow and another that begins where the real-time simulation ends and forecasts how the flow and the river stage (water surface elevation) will change in the future. These two simulation models are illustrated in Figure 5, which shows how a forecast of the river stage over time is developed for a single reach (no branches, confluent flows or irregular geometry that could cause abrupt changes or discontinuities in flow). Our real-time simulation begins at time t = t0. Figure 5a shows the acquisition of real-time stage data for upstream and downstream boundary points of the simulation. The stage data, recorded at field stations and transmitted to the modeling center at regular intervals, are incorporated in real time in our simulation model as boundary conditions for a stream reach of length L (Figure 5b). The water surface profile between the upstream and downstream boundaries, combined with flow rate (discharge) and other information, serve as initial condition data. The initial and boundary conditions are used to compute flow for a series of time intervals. The computational method that we employ outputs results for the rectangular space in the figure bounded by three fixed boundaries, the t = t0 line and the upstream and downstream boundaries, and one moving boundary, the t = present line. The output within that region is mapped to the zones marked I, II and III. The computational results for Zone I depend entirely on initial conditions, Zone II depends on initial and boundary conditions, and Zone III depends entirely on boundary conditions—features that will be important when we switch from real-time simulation to forecast simulation.
Barbara Aulicino and Morgan Ryan
In the real-time part of the simulation system, continuous boundary-condition data are received from field stations, allowing us to compute the unsteady flow over time and generate a relief map of the stage surface data up to the present (the purple surface in Figure 5b), after which we run out of boundary-condition data.
Figure 5c and 5d portray the principle of predictive unsteady-flow simulation. The forecast simulation begins at the present time of the real-time simulation. We want the computations of forecast stages and other unsteady flow data to proceed forward in time, but with only initial-conditions data available, the computation will be confined to the triangular area of Zone I unless additional boundary-condition data are provided. Lacking (future-time) field data, we need to supplement the boundary-condition values.
We respond with extrapolated or best-estimate values for the future boundary-condition data. Clearly, the quality of the forecast simulation depends on the accuracy with which the boundary-condition data can be projected. In Zone I of the forecast in Figure 5c, we expect high accuracy. Even though the calculated results for this region occur in future time, according to the principle of the method of characteristics, they depend only on the initial values at the current time, t = present; they are not dependent on changes that occur in the future. In the early part of the simulation, the predicted surface profile along the channel is therefore mostly made up of a non-future-affected part, with two small parts (orange triangles in Figure 5c) that are slightly affected by future uncertainty. If the extrapolated boundary values can be predicted with confidence (heavy black dashes in Figure 5d), we can add to the forecast the chevron-shaped blue region between the heavy dashes as a region of high confidence.
The forecast progresses in this manner as t continues into the future, with the levels of confidence within the mapped regions progressively falling. Using these data, we advance by time steps to solve for the unknowns (stage, depth, velocity, discharge and so on) for the entire region. The previous paragraphs give only the basic physical principles employed by this flood-forecasting model. To execute the actual task of modeling and simulation of a river basin system, the concrete numerical scheme (MMOC-II, in this case) must be applied to each channel reach and junction individually and incrementally over time.
The model described so far allows fairly reliable predictions for several forecast hours. But in the face of dangerous floods, earlier warning is immensely valuable. To extend the length of forecast time, a few special techniques, mostly stochastic, some deterministic, have been developed. For example, for the upstream boundaries, where the influence of the tides is normally absent, we have devised a rainfall-stage model that relates the rate of rainfall upland/upstream directly to the rate of change of the river stage at a boundary point in the river channel, which is a more direct evaluation for our purposes than the more commonly employed rainfall-discharge (or rainfall-runoff) model, which relates rainfall to the discharge at the boundary point. We can, in turn, link the upper end of the rainfall-stage model to another such model, named the typhoon-rainfall model, for yet another extension. In this case, we fetch key parameters about the approaching typhoon, such as the location of its center, its radius and maximum near-center wind speed, and we correlate these parameters with the expected rainfall at the upland rain-gage stations. Using these techniques, we are able to extend the flood forecast to as much as 24 hours.
For the river-mouth boundary, a highly accurate physics-based model was employed, one using harmonic analysis to assemble a sufficient number of astronomical tide components. (Timing of tides according to tide tables may be quite precise, but the tables are accurate only for specific locations. Accurate data for other locations often require interpolation, the more precise the better.) The tide data may be extended by a stochastics-based storm-surge model if the storm surge is expected to be significant, resulting in composite boundary stage data.
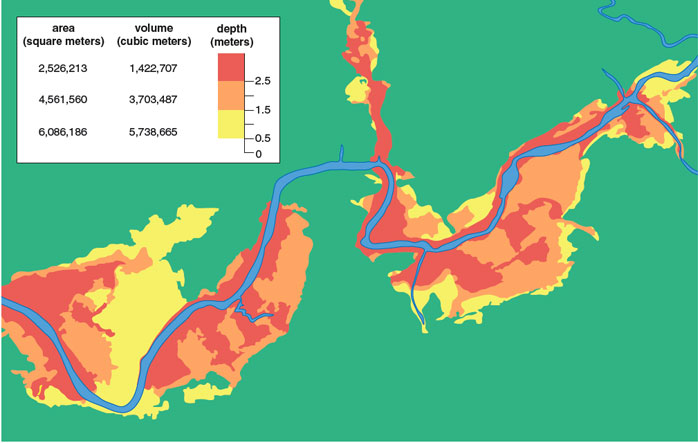
With data about the volume and timing of flows in hand, we use geographic information system (GIS) data to estimate the regions that will be inundated by flooding, based on precise contour models of the terrain. Our objective in adding this model was to be able to forecast for civil authorities and the general public the actual neighborhoods most likely to be flooded when a typhoon of a given magnitude invades the area. Rather than generate a computationally very expensive three-dimensional hydrodynamic solution, we opt for the considerably simpler expedient of a mass-conservation approach, estimating the inundation zone by assessing precomputed volumes of water against the volumes of lower-lying areas defined in the GIS datasets. Figure 6 illustrates over-bank flows along the Sitze section of the Keelung River. The figure depicts color-coded inundation zones for various water depths and the corresponding inundation volumes.
Barbara Aulicino
The combination of the river channel flood-stage forecast model and the flood-inundation estimation model offers policy makers and flood-protection authorities a set of reliable and dynamic tools with which to predict oncoming floods, allowing them to issue timely warnings and launch appropriate emergency responses.
When HIRDT began our work with the 10th River Bureau, the plan was to develop our project systematically, and ultimately to house it in the Tamsui River Basin Flood Control Command Center, supported by that facility’s infrastructure and computing resources. There we would pursue the usual timeline: Test our ideas, develop input and output subprograms, develop our databases of hydrological data, test the integrated system rigorously, find problem areas and make improvements, then test again. But time and typhoons wait for no hydraulician. Typhoon Nari arrived in northeastern Taiwan on September 14, 2001, and she was a wild one. Nari proved to be a most peculiar typhoon, dumping record amounts of rain and refusing to leave. The winds of Nari were not as violent as those of many typhoons Taiwan had seen before, but Nari hovered over Taipei for an astonishing two full days. When record rainfall was met by the incoming tide, the city of Taipei became swamped within mere hours. The previous local record for rainfall in a single day was 358 millimeters. Nari delivered over 400 millimeters on the first day of her assault.
As torrents rushed into the narrow and winding Keelung River, there was no time to lose. Despite our incomplete preparations, the flood forecast model was put into action. The office of the first author, situated in the Hydrotech Research Institute, National Taiwan University, was converted into an impromptu control center. Tasks were assigned. One team member established contact with stations in the field to acquire real-time data. Another entered those data into a computer. Another channeled the data into our new programs and interpreted the results. Simulation output was converted into computer graphics and animations. Key field locations were monitored for auxiliary data. As fresh simulation data accumulated, boundary conditions were updated and future water-surface profiles were projected. The dawn of the second day of Nari’s visit found the entire team hard at work in the “command center.”
Outside, the Taiwan Journal compared the scene to Venice without the gondolas. The greater Taipei area was experiencing the worst flooding in 50 years.
Morgan Ryan
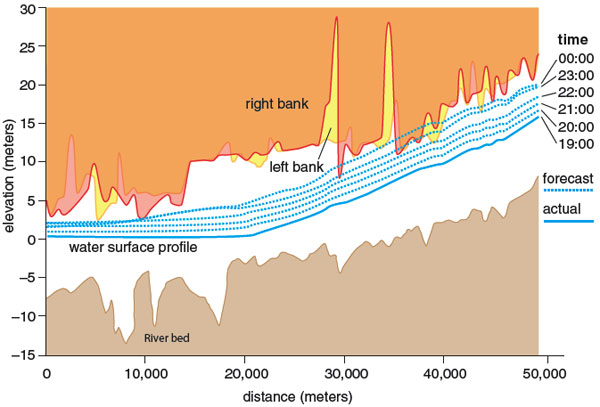
In the command center, the experience was grueling and exhilarating. We applied the model to the whole Taipei basin, with close monitoring of the Keelung River reaches until the floods subsided on September 21, 2001. The result was dramatic: a perfect forecast. Figure 7 shows a forecast of water-surface profiles for each hour over five hours for a section of the Keelung River feeding into the Tamsui River. The model predicted accurately the time and place at which the river torrent would overtop the banks near Great Nan-Hu Bridge and the She-Hou Bridge.
Our report of this prediction helped the river authority issue timely warnings and take other appropriate emergency measures that very likely saved lives, as there were no deaths reported as a result of this overtopping event. And with that we achieved a critical goal of our labor: lives saved and suffering averted by a civil authority armed with flood-forecasting powers.
Our work also affirmed the progress of the disciplinary area to which the crew of the HIRDT had devoted themselves—the application of a deterministic model to unsteady-flow hydrodynamics. The event was a victory of theory and technique: The design algorithm held together as we executed the modeling procedures; the simulation activities themselves proceeded smoothly; and the forecasts were more exact than we could reasonably have hoped.
Following the successful though somewhat frenetic forecast of Flood Nari, the HIRDT team was poised to meet and disarm the next in the steady train of flood-bringing typhoons: Haiyan, Lekima, Sinlaku, Nakri, Melor, Conson, Mindulle, Kompasu, Rananim, Aere, Haima, Nocktan .… For each storm, HIRDT crew was on duty at the Flood Forecast Center of the 10th River Management Bureau, vigorously applying the real-time flood forecast model. The simulation results were reported to civil authorities as regularly timed warnings or intermittent emergency messages when dramatic changes in the rate of flow were predicted, fulfilling our technical goal of real-time, basin-wide, tide-affected, unsteady open-channel flow simulation.
The authors acknowledge valuable support from the Water Resources Agency, Ministry of Economic Affairs, Taiwan, and the research facilities and environment provided by the 10th River Management Bureau and the Hydrotech Research Institute, National Taiwan University.
Click "American Scientist" to access home page

American Scientist Comments and Discussion
To discuss our articles or comment on them, please share them and tag American Scientist on social media platforms. Here are links to our profiles on Twitter, Facebook, and LinkedIn.
If we re-share your post, we will moderate comments/discussion following our comments policy.