Structures Smaller than Light
By Robert Kosara
Jane S. Richardson's elegant ribbon drawings have helped biologists understand protein function
Jane S. Richardson's elegant ribbon drawings have helped biologists understand protein function
DOI: 10.1511/2008.75.498
The elegant ribbon drawings that became standard depictions of proteins originated in the sketches of Jane S. Richardson, now a professor of biochemistry at Duke University. The schematics Jane and David Richardson created and refined continue to help biologists untangle protein structures—combinations of helices (corkscrew shapes) and strands gathered into sheets—and thus tie form with function.
R. K. Your biography in a recent meeting program ended with the sentence, "She now has three honorary degrees to fill in for her lack of a Ph.D." Can you tell us a bit about your background?
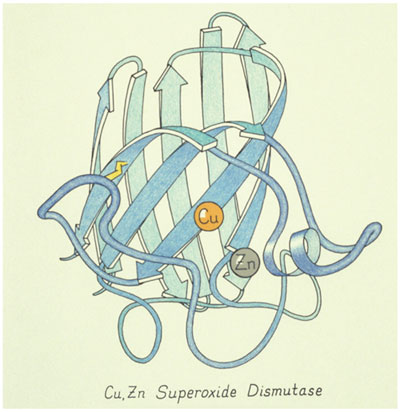
Image courtesy of Jane Richardson.
J. S. R. In high school,I was a very active amateur astronomer; later I majored in math, physics and astronomy in college. I switched to philosophy at some point, and went to graduate school at Harvard for a year. I even got an M.A. in teaching. Eventually, I ended up joining the lab at MIT where my husband was getting his degree. This was in the '60s, right after the structures of two important proteins, hemoglobin and myoglobin, had been published. It was an exciting new field, and I was fascinated by these complicated structures. I treated them as another kind of natural history, similar to astronomy. The philosophy training turned out to be quite useful; it makes you skeptical about everything. I later joined Duke University, originally in the anatomy department and later in biochemistry with my husband.
R. K. How are the source data for this work acquired?
J. S. R. The data are collected using x-ray crystallography. Proteins make repeating crystals, which cause discrete diffraction of light. To reconstruct the crystal structure, you would need to measure the phase of each diffracted beam, but you can only measure its amplitude. There are tricks for measuring the phase, like replacing common compounds with others that diffract x-rays more strongly.
A Fourier transform relates the resulting diffraction image to the desired image of the protein in the repeating unit of the crystal.
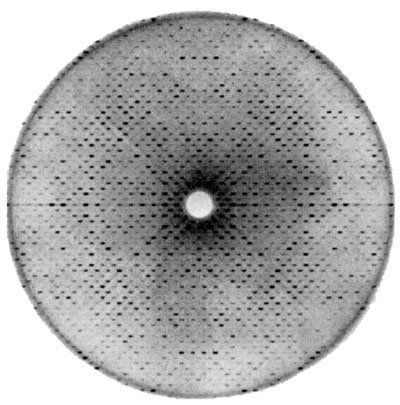
Image courtesy of David and Jane Richardson.
R. K. Where did the idea of ribbon diagrams of protein backbones come from?
J. S. R. I wrote a review article to classify proteins and needed a consistent system to show related proteins from the same viewpoint to make clear that they were related. There were about 75 known structures at that time (around 1980), and I made drawings of all of them.
Proteins are inherently three-dimensional: They are handed, asymmetrical and irregular. It's hopeless to make sense of a two-dimensional picture of the model or the atom positions. There are recurring patterns that are not really regular or quite the same, like the alpha helix, or the extended strands of protein backbone that interact with each other to form what are called beta sheets.
Proteins are inherently three-dimensional. They are handed, asymmetrical and irregular. It's hopeless to make sense of a two-dimensional picture of the model or the atom positions.
These structures are abstract because there is no photorealism: They are smaller than the wavelength of light, and the ribbons are not literally there. We tried out a lot of different representations, but the ribbons turned out to be the best representation of the overall structure. It is also possible to add details to a ribbon, like side chains or something bound to it.
R. K. Do you think that students would learn from drawing proteins by hand?
J. S. R. That is certainly true to an extent, but I am glad that I don't have to do the drawing by hand anymore. You also learn a lot from writing computer visualization tools; working out the algorithms is very educational. And even when using someone else's program, you pick the viewpoint and finding the alpha helices by hand (which you can do in our programs, in addition to automatically). Producing a good image is always a lot of work, making a single illustration that shows a point really well is always a challenge.
R. K. Because of the way the data are acquired, you essentially start with an image—the diffraction image—as your source. Is that how people consider it in biochemistry?
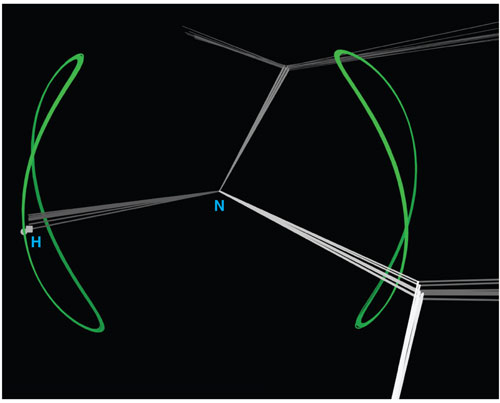
Image courtesy of Vincent Chen, Jeremy Block and Jane Richardson.
J. S. R. That is actually quite a discussion in crystallography. A crystallographer will argue that the diffraction spots are the data, but there is also talk about the three-dimensional electron density image that is produced from that as the data, or the coordinates as the data. But what really is the original data is a difficult concept. In a sense, the 3D electron density is very close to being the data.
Of course today, image plates are used to collect the data electronically; we no longer use film. But those plates act a bit like a camera image.
R. K. How does using an immersive environment change the perception of proteins? What are the advantages and disadvantages?
J. S. R. Working in the DIVE [Duke's immersive visualization environment] is very appealing. The DIVE is a great motivation tool, because you get a visceral feeling for 3D objects. We are currently visualizing the residual dipolar coupling (RDC) data, which helps determine NMR (nuclear magnetic resonance) structures. Each RDC measures the orientation of a particular atom-atom bond, very different from the absolute positions in space determined with x-rays. The odd thing is that the NMR people never visualize the atom-atom orientation on the model.
We are learning a lot of things from this. The images are also very pretty. The simplest case is a circle, but they end up in a Pringles potato chip shape, which makes very nice patterns. These patterns show the orientations that would be compatible with a given data measurement, so the model can be modified to fit the data better.
R. K. What is the role of interaction: Are protein structures read-only?
J. S. R. Interaction is of course a big deal. You can move around, zoom in, identify things, and even make changes to models and get assessments of those changes. We use a simplified physical model that is updated in real time as things are moved around. It is not using energy parameters, but it does include physical interactions like steric clashes and also empirically based generalizations like how favorable a particular conformation is.
Click "American Scientist" to access home page

American Scientist Comments and Discussion
To discuss our articles or comment on them, please share them and tag American Scientist on social media platforms. Here are links to our profiles on Twitter, Facebook, and LinkedIn.
If we re-share your post, we will moderate comments/discussion following our comments policy.