This Article From Issue
September-October 2021
Volume 109, Number 5
Page 266
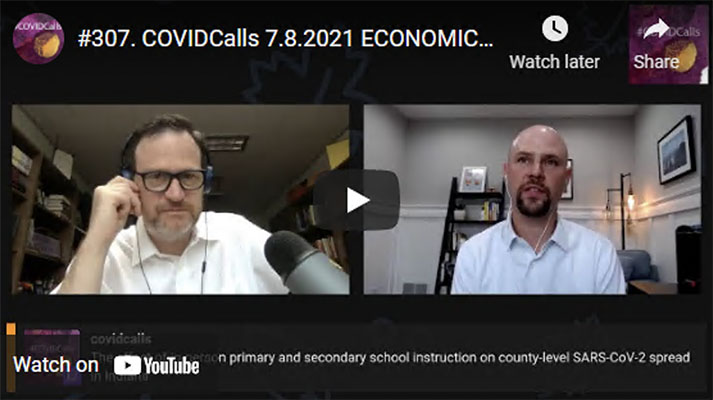
An issue that has loomed large in public discourse about the COVID-19 pandemic is the question of how the various shutdowns and stay-at-home orders have affected the economy. Micah Pollak has been trying to answer that question through research and the creation of data visualizations that put the pandemic in context. Pollak is an associate professor of economics and the director of the Center for Economic Education and Research in the School of Business and Economics at Indiana University Northwest in Gary, Indiana. His research interests cover a wide range of topics, including data analytics, health economics, financial economics, and regional economics. Pollak says that the rich data available in nearly real time throughout the pandemic have created an unprecedented opportunity for social scientists to study changing trends. He has been applying his teaching experience toward communicating his findings to the public using graphs and other visualizations on social media. Pollak spoke with Scott Knowles, a historian of risk and disaster at the Korean Advanced Institute of Science and Technology, on his daily podcast, COVIDCalls. On the podcast, Knowles speaks to guests about their research and the far-reaching effects of the pandemic. This interview is part of an ongoing collaboration between American Scientist and COVIDCalls. It has been edited for length and clarity.
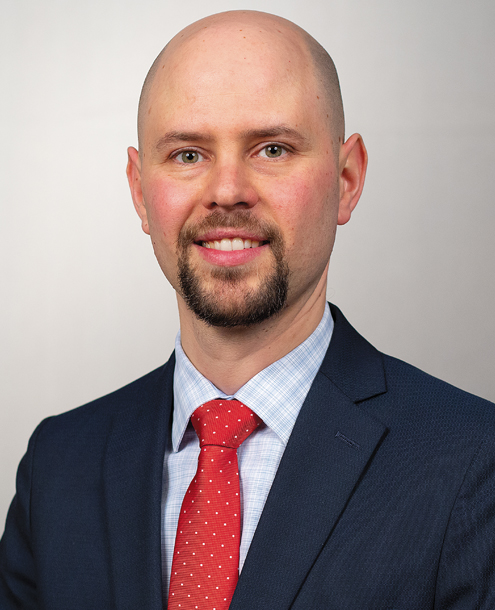
Photograph courtesy of Micah Pollak.
What can be said at this point about the effect of this pandemic on the national economy?
In some ways we’re surging back much faster than we would have expected, because nothing was permanently altered. But in other areas, in particular labor, we’re seeing big consequences. I don’t think it’s a coincidence that national headlines have focused on labor—such as unemployment insurance and extensions of benefits—because that’s where I think we’ll see the most long-term changes as a result of the pandemic.
How do you think about the discourse last year around the relief payments in the United States?
The relief payments were an equalizer, in the sense that there was a minimum amount of money that you could count on. There is pretty strong evidence that they had a significant effect on people’s livelihoods. They kept many people out of poverty and probably saved lives as well.
I’m sure the payments will be the focus of research in years to come. In a sense, we had a miniexperiment with universal basic income. And I think that changed people’s perspectives on what income is and how the government could help people.
What forms of conventional wisdom have been provoked and pushed during the pandemic?
Early on, whenever a region or a nation shut down, there was this automatic reaction, “That’s going to kill the economy.” A lot of economists, including myself, felt that wasn’t the case. Our economy was hurting because of the pandemic. The way that you address that economic problem is by dealing with the pandemic. You need to lower the spread to the point where people feel comfortable again.
How has the economy of Indiana, where you work, been affected by the pandemic?
Northwest Indiana is an industrial region: a lot of steel mills and manufacturing. The steel mills remained open as much as possible. There were instances where there was an outbreak and sections would have to be closed down.
Before COVID, we were in a trade war, which created challenges in Northwest Indiana, because we export a lot of steel and soybeans [which were subject to international tariffs]. The trade war is still going on. Certainly, in terms of employment, we don’t see jobs coming back rapidly here. We’re still well below the prepandemic level. I think that surprises a lot of people, especially because we’re not just talking about food service jobs, we’re also talking about manufacturing jobs and higher-paying jobs.
How have you approached taking complicated data sets and rendering them into something that a nonexpert can understand?
My goal has been to create visualizations that help people understand the data. One of the first visualizations I made, which created lots of controversy, was comparing flu deaths in Indiana by week with COVID deaths, just putting them side by side. Objections people raised online included: We don’t test flu and COVID in the same way. And: We don’t have a vaccine for COVID, but we do for flu, so you have to adjust for whether people are vaccinated or not. So I refined my visualization and said, “Okay, if you don’t like this part of the assumptions, we can change them a bit and make it more compelling.” It’s an iterative process.
“One well-designed visualization has the potential to demolish a lot of misinformation.”
The objections fit with what I was trying to do perfectly fine, because I’m trying to distill the information. The first graph I made used last year’s flu data. Then, someone pointed out that last year was an unusually light year. So I said, “Let me go back and find the deadliest flu season in the past 20 years in Indiana, and use that instead.” And then I slowly whittled away at the objections. Some people you’ll never convince, but if you can preemptively deal with as many objections as possible, then that makes the visualization more effective.
Social media can be somewhat of an echo chamber, but I do think that it’s hard to disassemble something that has gone through multiple iterations, has had feedback from lots of different people, has been improved upon, and has sources listed.
One well-designed visualization has the potential to demolish a lot of misinformation. It does take more work to make one good visualization, but once it’s created, it’s hard to argue with, because everything is laid out clearly.
You and an interdisciplinary team of colleagues published a paper in Clinical Infectious Diseases on the effect school reopenings had on the spread of SARS-CoV-2 in Indiana. This local study has broad implications regarding the return to school in the middle of a pandemic. What did you learn?
Indiana didn’t standardize how schools were going to reopen—it was left up to the local school district and the county health department, which meant that everything under the Sun was happening. Some places were sticking with 100 percent e-learning the whole year; other places were in-person full time. We saw this as a natural experiment where we can see whether districts that were mostly in-person had a lot of cases, and whether those that were doing e-learning reduced spread. [For a summary of research on this topic, see “Does In-Person Schooling Contribute to COVID-19 Spread?”]
There had been studies about in-person instruction, but they mostly focused on the classroom itself. Those studies are problematic because there were all sorts of issues with data collection. Schools had an incentive not to encourage parents to test their kids as much, and parents sometimes didn’t want to get their kids tested, because at the time the test was invasive.
We came up with a study idea looking at school districts and counties to see how they reopened, and then at the community spread. If there’s spread that’s happening in the classroom, then we’ll see a rise in cases in the community as well.
We found that during the 90-day period after schools opened, the additional students would have added about 1 percent more cases. I think the true value of the study was that it put a numerical value on the risk of opening schools in person. And then it’s up to the individuals to decide whether that’s a risk they’re willing to take or not.
We’re hoping that the study will be helpful for policy decisions, but the circumstances have changed. We did this study before the Delta variant, and we have more variants coming. We also have a large percentage of the population vaccinated.
The original interview is presented below in its entirety:

American Scientist Comments and Discussion
To discuss our articles or comment on them, please share them and tag American Scientist on social media platforms. Here are links to our profiles on Twitter, Facebook, and LinkedIn.
If we re-share your post, we will moderate comments/discussion following our comments policy.