Accounting for Climate in Ranking Countries' Carbon Dioxide Emissions
By Michael Sivak, Brandon Schoettle
A system that includes the variable of local climate provides a fairer measure of carbon dioxide emissions
A system that includes the variable of local climate provides a fairer measure of carbon dioxide emissions

DOI: 10.1511/2012.97.278
Increased concern about carbon dioxide emissions has resulted in efforts to create methods for ranking countries according to their emissions. Such rankings inform policy decisions on an international scale; the more comprehensive these rankings are, the better our chances of reducing emissions. It has long been recognized that comparing individual countries based on their absolute amounts of carbon dioxide emissions is problematic. So it is common to adjust the total amount of emissions in order to account for the size of each country’s population and its overall economic output. These adjustments result in measures such as emissions per capita and emissions per gross domestic product (GDP).
We feel it is important to go a step further, taking into account another factor: the general heating and cooling demands that are imposed by the climate of a given country. The population of a country cannot choose the local climate, of course; that is determined by geographical location. Thus, people must deal with the temperature of their locale using the heating and cooling methods available to them. There are significant incentives for doing so: Effective indoor climate control results not only in increased comfort, but also in improved health and increased productivity. Consequently, in evaluating countries’ carbon dioxide emissions, we should not overlook climate.

Keren Su/Corbis
One approach for incorporating climate into emissions rankings would involve subtracting emissions caused by heating and cooling from total emissions. However, a variety of technologies provide heating and cooling, resulting in widely varying amounts of carbon dioxide emissions per degree of change in indoor temperature. Even if information about emissions from indoor temperature regulation were available for each country (which it is not), this approach would not reward countries that rely primarily on carbon-efficient methods of climate control, nor would it penalize countries that rely on carbon-inefficient methods. Thus, an alternate approach is necessary.
The approach we recommend involves adjusting each country’s emissions by the combined demand for heating and cooling based purely on climatology, not on the actual methods employed for changing temperature. Specifically, this approach involves adjusting the amount of emissions in accordance with the total number of heating degree days and cooling degree days, which allows us to calculate the amount of emissions per heating and cooling degree day. Heating degree days offer an index of the energy demand required to heat indoor spaces. This index is calculated by subtracting the mean daily outdoor temperature from 18 degrees Celsius and summing up only positive values over a fixed period, such as an entire year. Cooling degree days represent an analogous index of the energy demand for cooling.
For an average outdoor temperature lower than 18 degrees, most buildings in developed countries require heating to maintain a 21-degree indoor temperature. Conversely, for an average outdoor temperature higher than 18 degrees, most buildings require cooling to maintain a 21-degree indoor temperature. The selection of 18 degrees as the base outdoor temperature accounts for the additional heat generated by occupants and their activities, resulting in an average indoor temperature of 21 degrees at 18 degrees outdoors.
Heating and cooling degree days, being based solely on temperature, do not take into account secondary variables influencing the need for heating and cooling (such as humidity and cloud cover). Nonetheless, studies have shown that energy consumption is highly correlated with degree days for both heating and cooling. Total heating and cooling degree days is a combined index of heating degree and cooling degree days. (This index does not incorporate potential differences in the energy expenditures required to heat or to cool by one degree.)
Let’s consider an example. Country A and Country B have the same total emissions per capita and GDP. However, Country A is located in a relatively extreme climate (either very cold or very hot), and Country B is located in a mild climate. Country A thus has more population-weighted heating and cooling degree days (taking into account where within the country people live) than does Country B. Under traditional measures, the two countries would have the same ranking. But our intuitions recognize Country A as a much more efficient emitter—and this difference is reflected in the new measure.
No one-to-one correspondence can be made between actual emissions and demand based on climate. First, technologies for cooling indoor spaces, such as air conditioning, are not yet universally accessible. Second, the set point (the thermostat setting for the indoor temperature) varies between individuals and between countries. Third, the various options for climate control that are in use—heating by oil, natural gas, electricity and geothermal energy, for instance—have different consequences for carbon dioxide emissions. Our proposed approach bypasses all of these considerations by providing an adjustment based purely on climatology.
To attain a measure of emissions that incorporates climate, we used three variables for each of 157 countries: carbon dioxide emissions per capita, GDP per capita (adjusted for differences in purchasing power between countries) and a population-weighted average of the total heating and cooling degree days. For the first two variables, we used data from 2008; the third is based on average annual heating and cooling degree days calculated for various recent time periods. These variables allowed us to calculate rankings of carbon dioxide emissions based on three measures: per capita; per capita and GDP; and per capita, GDP, and heating and cooling degree day.
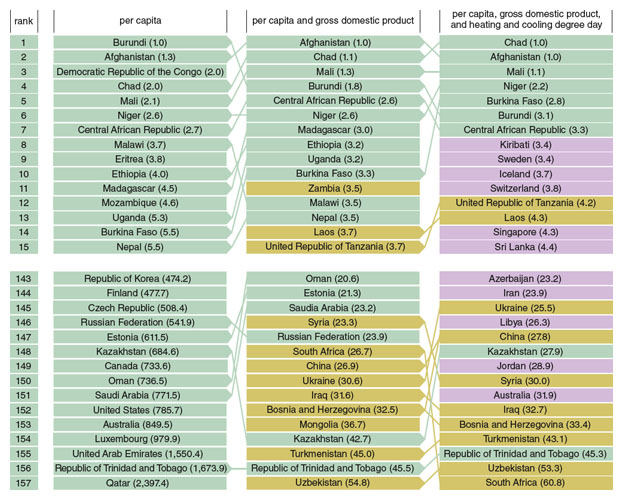
The 15 lowest and highest emitters on each measure are shown above. Using emissions per capita, GDP, and heating and cooling degree day, the 10 lowest emitters (in ascending order) are Chad, Afghanistan, Mali, Niger, Burkina Faso, Burundi, the Central African Republic, Kiribati, Sweden and Iceland. Six of these countries are in Africa, two in Europe and one each in Asia and Oceania. The 10 biggest emitters (in descending order) are South Africa, Uzbekistan, the Republic of Trinidad and Tobago, Turkmenistan, Bosnia and Herzegovina, Iraq, Australia, Syria, Jordan and Kazakhstan. Six of these countries are in Asia, and one each is in Africa, the Caribbean, Europe and Oceania.
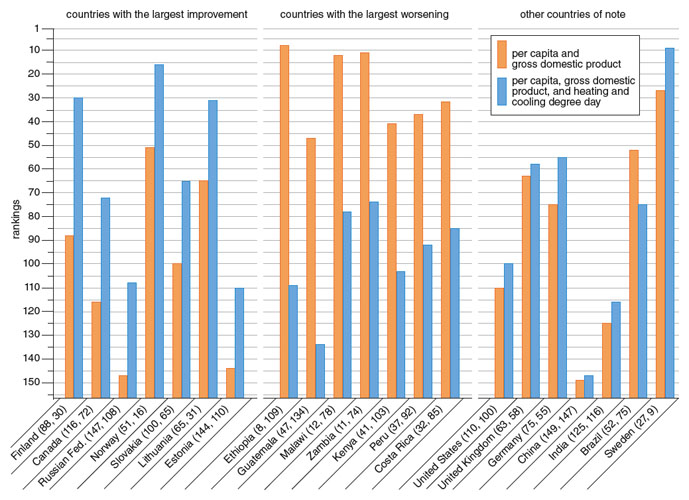
Taking climate into account improves emissions rankings for countries with relatively high heating and cooling degree days. For example, the United States moves from the 110th spot (when only population size and economic output are included) to the 100th spot (when climate demands are considered as well); the United Kingdom moves from 63 to 58, Germany from 75 to 55, Sweden from 27 to 9, China from 149 to 147 and India from 125 to 116. But not everyone comes out for the better under the new approach. Countries with relatively low heating and cooling degree days get a less favorable ranking when climate is added into the equation. Among the countries with a substantial worsening are Australia (which goes from 126 to 151), Brazil (52 to 75), Israel (48 to 76) and Mexico (93 to 117). Changes in ranking for the seven countries with the largest improvement in ranking, the seven with the largest worsening, and seven additional countries of general interest are shown in the figure above.
Comparing different countries’ respective emissions yields intriguing differences. South Africa (the highest emitter) produces about 61 times more emissions per capita, GDP, and heating and cooling degree day than does Chad (the lowest emitter). This range is comparable to the range of emissions per capita and GDP: Using the latter measure, the highest emitter, Uzbekistan, produces 55 times more emissions than does the lowest emitter, Afghanistan. Both of these ranges are substantially smaller than the range considering population alone: The highest emitter, Qatar, produces 2,397 times more emissions per capita than does the lowest emitter, Burundi.
Our results suggest that taking climate into account makes a significant difference in how countries fare in carbon dioxide emissions rankings. Because people respond to the climate they live in by heating and cooling indoor spaces, an index that incorporates climate provides a fairer yardstick than an index that does not. We hope that our approach will stimulate others to further refine this index to reflect even better the complexities involved in ranking countries on emissions.
Click "American Scientist" to access home page

American Scientist Comments and Discussion
To discuss our articles or comment on them, please share them and tag American Scientist on social media platforms. Here are links to our profiles on Twitter, Facebook, and LinkedIn.
If we re-share your post, we will moderate comments/discussion following our comments policy.