
This Article From Issue
March-April 2015
Volume 103, Number 2
Page 102
DOI: 10.1511/2015.113.102
Except when an earthquake strikes or a volcano erupts, the ground beneath our feet seems still. It’s an illusion, of course: Earth’s tectonic plates migrate across the surface at an average rate of 2 to 4 centimeters a year. Where two plates collide, one typically gets pushed into the mantle, a process known as subduction. Where plates are separating, as happens along the Mid-Atlantic Ridge that runs through Iceland, molten rock rises from the mantle to form new crust. Some places move more quickly than others, but no place is truly at rest.
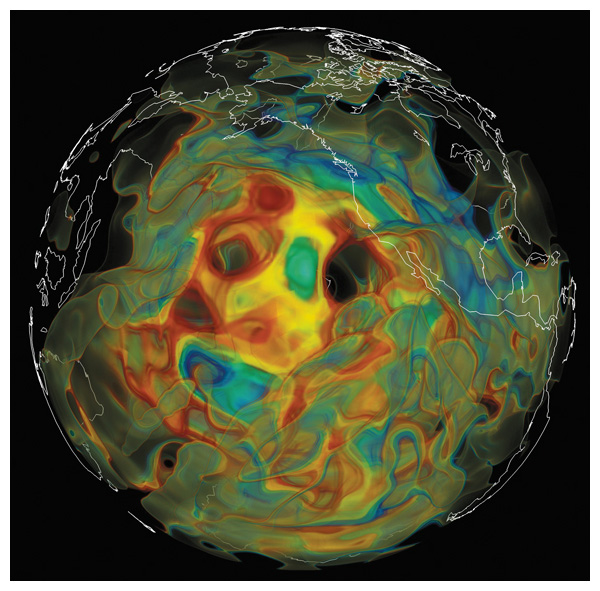
Image courtesy of Ebru Bozdag, University of Nice and David Pugmire, Oak Ridge National Laboratory.
Active for billions of years, tectonic motions are driven by enormous convection currents inside our planet; those currents, in turn, are powered by heat escaping from Earth’s dense core and the massive overlying mantle. The general process is well understood, but the details most certainly are not. Jeroen Tromp of Princeton University and his collaborators are attempting to produce improved maps of the mantle to reveal more structure and activity there. “With increased resolution will come increased understanding,” says Tromp, who has spent decades trying to optimize the use of seismic data to see inside Earth.
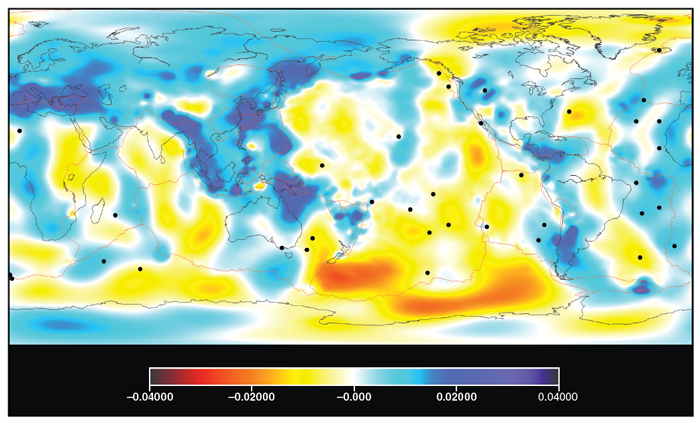
Image courtesy of Ebru Bozdag, University of Nice and David Pugmire, Oak Ridge National Laboratory.
Increased availability of three-dimensional seismic data, improved modeling techniques, and powerful supercomputers make Tromp’s pursuit possible. He and others use seismic waves to examine Earth’s interior much like the way physicians use x-rays to probe the inside of a patient. In medical imaging, computer-assisted tomography (CAT) measures x-rays transmitted in many directions through a human body to produce images. Tissues and structures each absorb x-rays in different ways. Computers generate images based on those differences. In seismic tomography, scientists create images of Earth’s subsurface using variations in the speed of earthquake waves traveling through the planet.
Seismic waves propagate more quickly through relatively cool material inside the Earth, including parts of a tectonic plate descending into the mantle; the waves move more slowly through relatively warm materials, including hot rocks rising toward the surface. The composition and crystal structure of mantle rock affect wave motions, too. Seismic maps as deep as the core-mantle boundary date to the 1980s, but Tromp and others are taking the science to a whole new level.
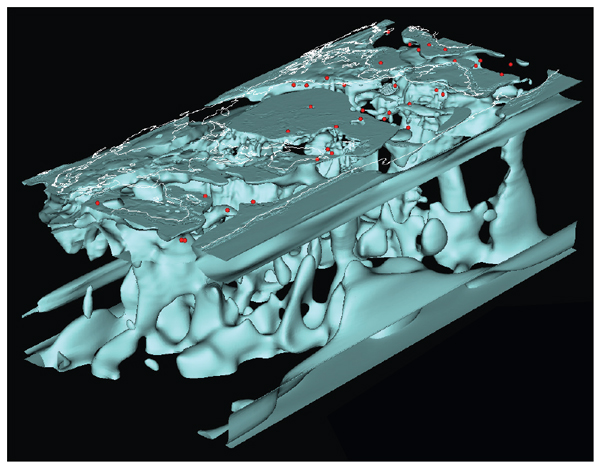
Image courtesy of Ebru Bozdag, University of Nice and David Pugmire, Oak Ridge National Laboratory.
Thousands of seismometers around the globe now eavesdrop on earthquakes, including sensitive arrays deployed by a US geoscience research consortium called EarthScope. Geophysicists previously used select portions of seismic data, such as the first pressure waves or the first shear waves, to map the mantle. Today’s vastly improved ground-motion measurements produce bigger data sets. Tromp, in particular, “uses much more of the seismic wavefield and therefore gives us a rich view of Earth structure,” says J. Ramon Arrowsmith, EarthScope’s national office director.
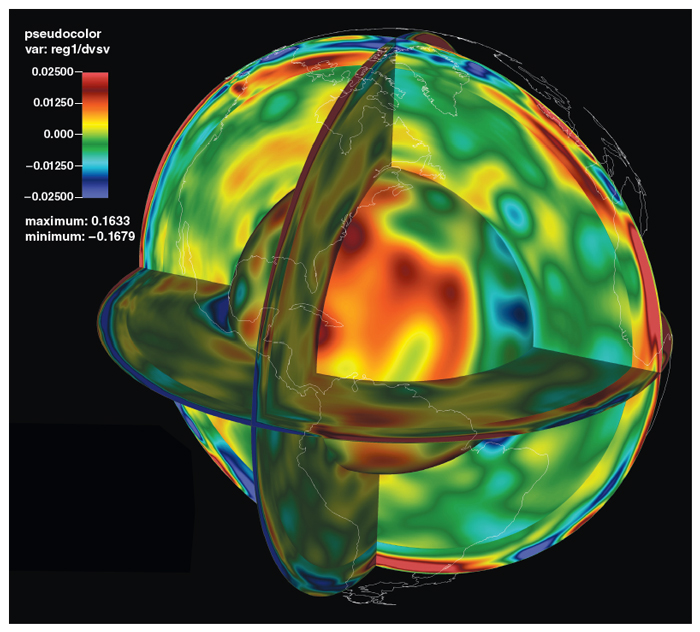
Image courtesy of Ebru Bozdag, University of Nice and David Pugmire, Oak Ridge National Laboratory.
Tromp’s latest maps integrate thousands of seismic records from individual earthquakes. Processing them requires Titan, the world’s second-largest supercomputer, which is located at the Department of Energy’s Oak Ridge National Laboratory in Tennessee. Even using Titan, Tromp’s team needed mathematical tools called adjoint methods to reduce the amount of computation required to identify and integrate the most pertinent data. Oak Ridge visualization specialists created customized tools to translate seismic variations into comprehensible maps of mantle structure. “Ultimately the images are everything. That is where you make the discoveries,” Tromp says.
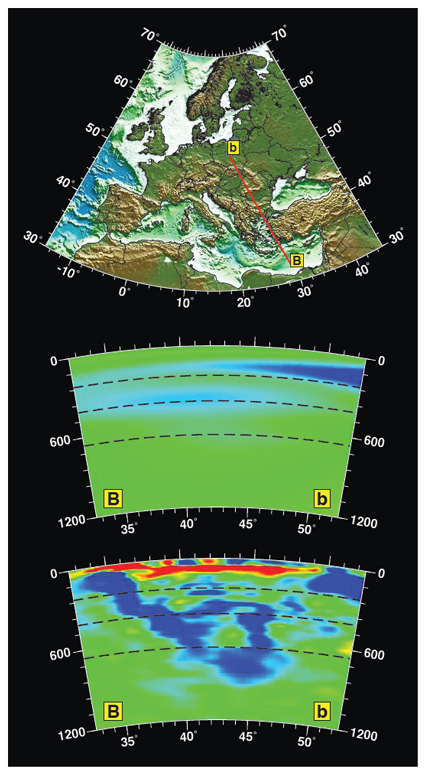
Image courtesy of Hejun Zhu, University of Texas at Austin.
In one proof-of-concept study, Tromp and his team mapped the upper mantle structure beneath Europe. Heju Zhu, now a postdoctoral researcher at the University of Texas at Austin, Ebru Bozdag, now a faculty member at the University of Nice, and Tromp processed seismic-wave measurements from 190 earthquakes recorded at 745 stations. The resulting models, published in Nature Geoscience in 2012 and in Science in 2013, showed greater detail in previously detected features such as slabs, magma upwelling, and sinking chunks of lithosphere (which includes the crust). New things sprang into view too, as signs of improved resolution. They include evidence of subduction beneath the Dinarides Mountains in southern Europe and a possible magma reservoir beneath the northern part of the Rhine Graben.
Tromp’s group is working on a paper describing their modeling and mapping of the mantle under Asia. The researchers are also looking at the mantle beneath Antarctica, and beginning an ambitious effort to map the full globe at mantle depths. At the same time Tromp keeps seeking ways to improve the view. “We’ll use anything and everything we can get our hands on,” he says.

American Scientist Comments and Discussion
To discuss our articles or comment on them, please share them and tag American Scientist on social media platforms. Here are links to our profiles on Twitter, Facebook, and LinkedIn.
If we re-share your post, we will moderate comments/discussion following our comments policy.