Visualizing Data
By Felice Frankel
MIT's Ben Fry discusses his innovative—and striking—visualizations of complex genomic data sets
MIT's Ben Fry discusses his innovative—and striking—visualizations of complex genomic data sets
DOI: 10.1511/2004.46.173
We are drowning in data—more and more information flowing from each new device or technique invented to measure something important in the world. How do we sift knowledge from this explosion of data, which screams for the clarity that visual representation might provide? The need to make sense of it all has made the graphical representation of scientific data a hot topic of conversation. We have fascinating examples from the historical record that help us, at the very least, to begin the conversation. But examples do not show us the path through the hard work of crafting credible guidelines and new representational tools. Many opinions on what works and what doesn't work seem just that—opinions. I am not sure anyone has yet measured or defined what "works."
I am convinced that to develop the much-needed new approaches to representing data, scientists must begin to embrace ideas from those who have not necessarily made a career in science but who have a serious interest in visual thinking and communication. In the process, we will learn that making intelligent and communicative representations will clarify the complicated ideas that are the data.
Ben Fry is a doctoral candidate in the Media Laboratory at the Massachusetts Institute of Technology. His research focuses on methods of visualizing large quantities of data from dynamic information sources. In this, the sixth Sightings, Ben and I examine one of his ideas on how to represent part of the vast store of data emerging from the new field of genomics. In my opinion, his intelligent and aesthetically beautiful approach "works."
F. F. When you first decided to delve into representing genetic mapping, I assume you took a look at how some biologists were already dealing with the issues. Did something immediately strike you as being absent or obviously wrong from the various representations you saw published?
B. F. I had just completed my master's at the Media Lab, which was about ways of doing information design. I was beginning my Ph.D. and was looking for an interesting and difficult data set to deal with. Genetics seemed fascinating for many reasons: (1) an obviously difficult data problem that (2) few people were looking at with regard to design and visualization, and (3) all the other social-cultural factors involved in how people understand this very important data set. It was a lecture by Eric Lander given at MIT that provided the initial metaphor (the search for a "periodic table") and provided the necessary perspective on where to get started.
F. F. How extensive was your background in the subject when you first began to look at the idea? What kind of preparation did you decide to orchestrate? Did you sit down and ask the researchers to explain this and that and to understand their needs?
B. F. My background was not extensive at the time, but I've spent a lot of time since then taking courses and reading as much as I can. In addition, I am now getting more involved with those doing genetics work on campus, i.e., over at the Whitehead Institute, where I work with some folks and sit in on their meetings to see what everyone's thinking about.
F. F. Are there back-and-forth conversations with these investigators?
B. F. Sure. It depends on the particular project. Some work is done directly with researchers (an upcoming population-genetics project, looking for connections between genomes and disease susceptibility). Other projects are initiated by them (http://acg.media.mit.edu/people/fry/haplotypes/) and require their input. Still others are just me trying to figure things out (the example that we are looking at in this column).
F. F. Did you find that the conversations also helped the researchers clarify some of the ideas for themselves?
B. F. This has slowly become the case as I get more directly involved in projects that they're working on. For instance, I redid the user interface and the visualizations for a particular project—a tool they used internally, called HaploView. I think it moved the project several steps forward from its previous state and made it the tool to use for larger projects.
F. F. Is there something in this representation you think you could improve upon? Is there a piece that you think is missing?
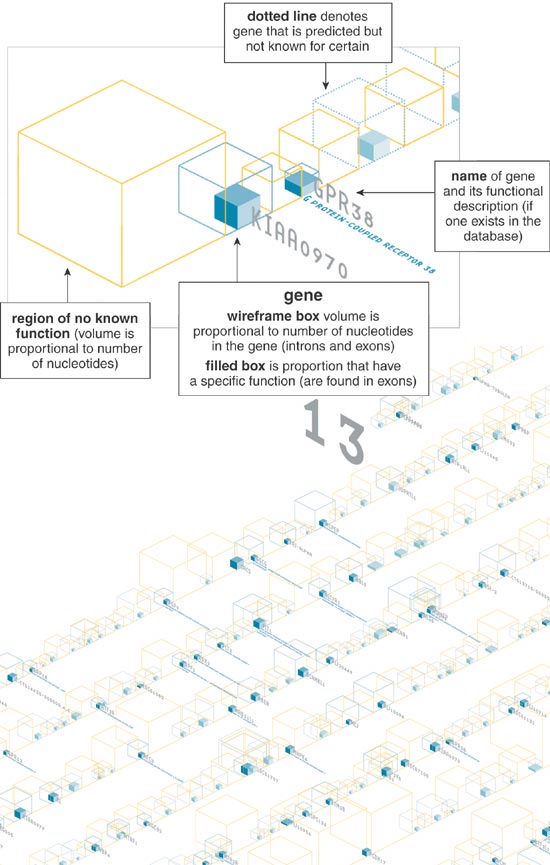
B. F. Absolutely. There are always things to improve. This diagram is just one method of looking at the data. I was attacking the problem of how to look at very linear sets of data in a way that was more compact. Thus, the three-dimesional scaling scheme shows their relative proportions of base pairs.
I think it's a nice solution for that particular problem, but it places too much emphasis on data that's probably not the most important thing. The proportion of used vs. unused material is emphasized, which is only marginally useful. However, it does provide a "regional" look at the genome, kind of like looking at a map of the U.S. showing where the mountains are, instead of the roads.
But I'd like to mix this with other, more relevant data to make it more useful than just a study on how to make data more compact.
F. F. Did you purposely decide not to include some information? If so, how did you decide? In other words, how did you begin to create a hierarchy of information?
B. F. This is always the case in visualization. One has to begin with a few things that are important, and make a diagram that most clearly represents only those data. If other pieces can be added, then great, but sometimes you can get more information from a diagram by including less of it.
The hierarchy comes from first setting out goals before starting the design. So, for the boxes, it was "how do I make the data more compact?" For other projects, it might be "how do I simplify what's considered 'the standard'? I discuss one such "standard" at length at this Web site: http://acg.media.mit.edu/people/fry/cartography/.
F. F. I always wonder about how certain sorts of graphical representations in science become "standard." My own opinion is that many exist because few scientists have taken the time and trouble to consider whether these standard representations are really the best way to communicate various data or ideas. It is probably an issue of time. After all, scientists are busy enough just collecting the data. Do you think that developing the best ways to represent data should also be part of the curriculum?
B. F. I absolutely think it's a time issue. For those who’d rather improve things, it's just an issue of "where do I start?" However, I think that "visual literacy" is just as important (if not more important) than the sort of writing literacy that's expected of scientists. The level of writing in a scientific journal far exceeds that of the visuals that support it—and I think the visual standard should be higher.
F. F. Do you think it would be valuable to invite the nonscientist into the conversation?
B. F. It all depends on the audience you're trying to reach. When I'm developing projects for nonscientists, I need to spend a lot of time with them to see how they relate to things. Trying to reach broader audiences, whether for children's education or just keeping adults interested in science, poses an entire additional set of problems.
F. F. How important are aesthetics in your designs?
B.F. Very. I believe that aesthetics are very important to understanding data and are too often treated as window dressing. For me, aesthetics have to do with clarity and simplicity, which help significantly in the understanding of a piece of work. This is not to say that diagrams need to be sophisticated and high-tech. It's simply that the purely aesthetic aspects should be heeded as part of the whole, rather than belittled as a way to make things "pretty."
F. F. I know that some of your maps are displayed as art. Is that your intention?
B. F. So far as it is possible, I'd love for my work to exist as useful artifacts that can be used by scientists but also enjoyed by a more general public in other settings like galleries. In the latter case, I want to get people intrigued by what's there, to encourage them to find out more. I find the subject matter fascinating, so if I can inspire that in anyone else, what could be better?
Click "American Scientist" to access home page
American Scientist Comments and Discussion
To discuss our articles or comment on them, please share them and tag American Scientist on social media platforms. Here are links to our profiles on Twitter, Facebook, and LinkedIn.
If we re-share your post, we will moderate comments/discussion following our comments policy.