Revealing the True Solar Corona
By Richard Woo
Imaging may have inadvertently led astrophysicists astray in understanding the Sun
Imaging may have inadvertently led astrophysicists astray in understanding the Sun

DOI: 10.1511/2010.84.212
The white-light corona, a halo of light revealed during solar eclipses, has dazzled and captivated humans for ages. Despite a long history of witnessing and reporting this curious phenomenon in nature, it was not until 1860 that the corona was recognized as representing the atmosphere of the Sun, not that of the Moon or Earth, thus marking the beginning of scientific study of the Sun’s atmosphere.
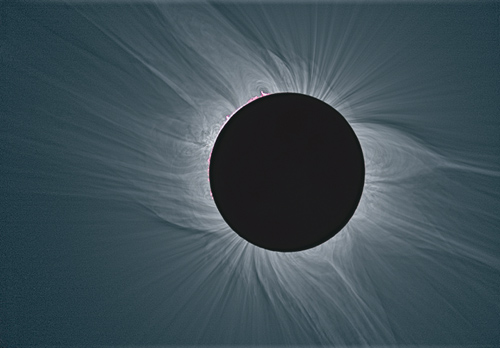
Photograph courtesy of Massimiliano Latanzzi and the American Astronomical Society (AAS).
In an era of rapid progress in science and technology, it is hard to imagine that it would take 150 years of investigating the visible corona to reach closure in understanding this phenomenon, or that recent results would so thoroughly revise current tenets of the solar atmosphere. But it is likewise rare for the psychological perception of an object to unwittingly influence its scientific study.
It is somewhat ironic that a total solar eclipse—the Moon blocking out the entire body of the Sun—actually reveals great detail of the Sun’s structure. When the blinding brilliance of the Sun is obscured, this allows its more tenuous surrounding features—its corona—to come into view. Investigating the corona may seem straightforward, but it requires an understanding beyond seeing, imaging and modeling.
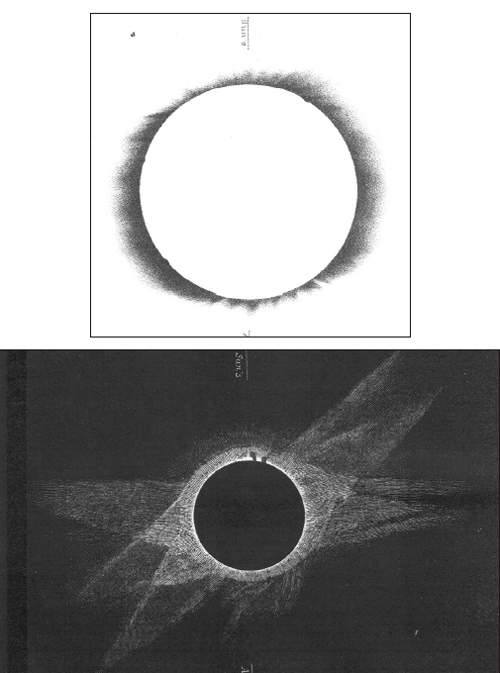
From A. C. Ranyard, Memoirs of the Royal Astronomical Society, 1881.
Eclipse studies of the white-light corona can be grouped roughly into three periods. In the first, during the latter half of the 19th century, naked-eye observations were only occasionally supplemented by photography. The former were carefully reported in written accounts and recorded in drawings and engravings that depended on the skills of astronomers, artists and engravers, as well as those who made and reproduced the pictures.
In his 1966 book on the solar corona, Donald Billings described this period:
… the latter 60 years of the 19th century marked the beginning of a real coronal science. The corona was recognized as an object worthy of study, and the familiar techniques for analysis of light—photography, photometry, spectroscopy and polarimetry—were all applied to it. The technique that was perfected in this period, however, was visual observation, which was carried out with enthusiasm and reported so eloquently that we who depend on photographs to record our observations return to the writings of the nineteenth century for adequate verbal descriptions of the corona.
One such description was given by solar scientist Charles Young in his 1896 book, The Sun:
A total eclipse of the Sun is unquestionably one of the more impressive of all natural phenomena, and the corona, or aureole of light, which surrounds the Sun, is its most impressive feature. On such an occasion, if the sky is clear, the Moon appears of almost inky darkness, with just sufficient illumination at the edge of the disk to bring out its rotundity in a striking manner. It looks not like a flat screen, but like a huge black ball, as it really is. From behind it stream out on all sides radiant filaments, beams and sheets of pearly light, which reach to a distance sometimes of several degrees from the solar surface, forming an irregular stellate halo, with the black globe of the moon in its apparent center. The portion nearest the sun is of dazzling brightness, but still less brilliant than the prominences, which blaze through like carbuncles. Generally the inner corona has a pretty uniform height, forming a ring three or four minutes of arc in width, separated by a somewhat definite outline from the outer corona, which reaches to a much greater distance, and is far more irregular in form. Usually there are several “rifts” as they have been called, like narrow beams of darkness, extending from the very edge of the Sun to the outer night, and much resembling the cloud-shadows which radiate from the Sun before a thunder- shower. Sometimes there are narrow, bright streamers, as long as the rifts or longer. These are often inclined, occasionally are even nearly tangential to the solar surface, and frequently are curved. On the whole the corona is usually less extensive and brilliant over the solar poles, and there is a recognizable tendency to accumulations over the middle latitudes or spot zones; so that, speaking roughly, the corona shows a disposition to assume the form of a quadrilateral or four-rayed star, though in almost every individual case this form is greatly modified by abnormal streamers at some point or other.
Even in those early days there was already some discrepancy between images and observer accounts. A July 29, 1878, eclipse was reported by Arthur C. Ranyard, a British lawyer and mathematician who also studied astronomy. Ranyard took a photograph of the event, while Charles Denison, a doctor in Denver, made a drawing that was turned into a woodcut (see Figure 2). Ranyard noted the differences between his photograph and the drawing he received from Denison afterwards. In his letter Denison said:
I have the pleasure to send you my drawing of the eclipse; the appearance was noted by others standing near, and the drawing is said to be a good representation of the tangents and consequent triangles of the light shooting out from the Sun. The spots … are indicated as observed by Prof. Burnham. I got a good view of the five streamers of light by the aid of a well-adjusted opera-glass. I think I have represented the structure of the corona.
As Ranyard noted in his report:
In observing the corona with the telescope I failed to detect the synclinal grouping of the coronal structure shown in Dr. Denison’s drawing, and no such groups of structure are shown upon my photographs, but it is quite possible that such groups may have been recognizable in the outer parts of the corona, though they were not registered upon the photographs, and were not visible in my instrument. The existence of such groupings in the outer parts of the corona is rendered probable by the fact that several observers described the corona in the western equatorial region as reminding them of a fish tail, and others described it as being like a forked wind vane.
Beyond such eloquent descriptions, the spectacular achievements of the early 20th century in astronomy and astrophysics led to changes in the role of the observer, with naked-eye observations and hand-drawn sketches of solar eclipses falling to the wayside. Instead, during the second period of eclipse studies, spanning the earlier half of the 20th century, solar scientists concentrated on photography and on gaining insight into the Sun’s atmosphere through quantitative or photometric studies of the coronal images.
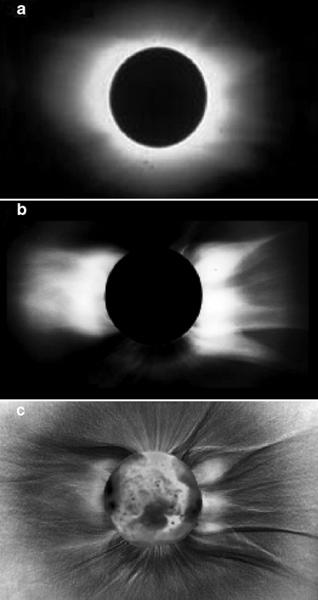
Photographs courtesy of Springer Science and Business Media.
Typical photographs of the corona show a globular shape (see Figure 3, at right, and Figure 5). The white-light corona forms when sunlight from the surface of the Sun or its photosphere is scattered toward us by electrons in the corona. Brightness corresponds to the density of the electrons (specifically to the number of electrons in a cubic centimeter): The higher the density, the brighter the corona. Brightness or density drops steeply outwards from the Sun, by more than a factor of 100 over a distance of a solar radius from the Sun’s surface. It is this extraordinary dynamic range that makes measuring and displaying images of the corona so challenging.
In his book Beyond Vision, science historian Jon Darius reminds us: “Interpretation is the key. Photographs, and a fortiori scientific photographs, utter sterling truths no more than do galvanometer readings.” The image and its quantitative measurements are indeed different representations of the same data, and relating them is imperative for elucidating the image.
When imaging solar phenomena it is important is to know what “phase” the Sun is in. The star undergoes a cyclical variation of about 11 years in the number of sunspots—regions of intense activity—and their location when they appear on the Sun. The Sun’s magnetic field appears to drive the sunspot cycle. Generated within the Sun, these magnetic fields give rise to a variety of dynamic effects that are collectively called the solar-activity cycle, and the sunspot cycle is simply the most easily observed manifestation of it.
Measurements of brightness, or profiles, are taken in “rings” at various distances radiating outward from the Sun. During the low portion of the solar- activity cycle (solar minimum), such profiles indicate that density drops more rapidly in the polar regions than it does in the equatorial region before reaching the sensitivity limit of the imager. This explains why the shape of the corona imaged during solar minimum stretches farther from the Sun in the equatorial than in the polar direction. During solar maximum, when the differences between the polar and equatorial regions are diminished, the corona is more spherical. The variation in shape of the corona is, therefore, another manifestation of the 11-year solar-activity cycle.
In the latter half of the 20th century, as part of an effort to reveal the faint parts of the corona farther from the Sun, imaging filters were introduced that were radially graded in density in order to compensate for the steep density falloff. The resulting corona appeared strikingly jagged in shape. To better show the small-scale structures, the images were additionally digitally processed to further enhance gradients. An alternative approach that has a similar effect is to combine and process multiple pictures taken with a range of exposures into a single image. Such “processed” images have been the medium of choice since the 1960s—the third and current period of eclipse studies—because they unveil details and elements of the corona seen by the naked eye but hidden in the unprocessed images, thus rendering a seemingly more complete picture of the structured and complex corona. But how the human eye sees the solar corona is not necessarily the whole truth.
Blind since the age of three, a man has his sight restored as an adult, only to find he cannot recognize faces. To him, they all look alike. Although distinguishing faces and investigating the corona are not directly related, they share a common mechanism for producing unexpected results: The intricate but subtle ways in which the eye and brain work together to produce vision.
As experimental psychologist Richard Gregory comments in his book Eye and Brain, vision is so familiar and natural to us that it takes a leap of imagination to appreciate that it results from the brain solving difficult problems presented to it by our eyes. What happens when we see is not a mindless process of stimulus and response. Instead, the brain is highly active in constructing perceptions based on barely adequate information from the senses. This process is sometimes referred to as active perception or visual intelligence, and its intricacies are now becoming clear to psychologists, neuroscientists and cognitive scientists.
Distinguishing between faces is one of the complex skills of visual intelligence that we develop starting in infancy. Denied that opportunity, the blind man whose sight was restored had not acquired the ability. We can see for ourselves that the brain treats faces in a special way by looking at the pictures of Margaret Thatcher in Figure 4. Except for being upside down, these pictures look fairly normal to most people. However, if we turn them right-side up, the weirdness of the one on the right becomes obvious. Although both eyes and mouth are turned upside down within the face, we don’t readily notice it because our visual intelligence is more accustomed to reading faces right-side up.
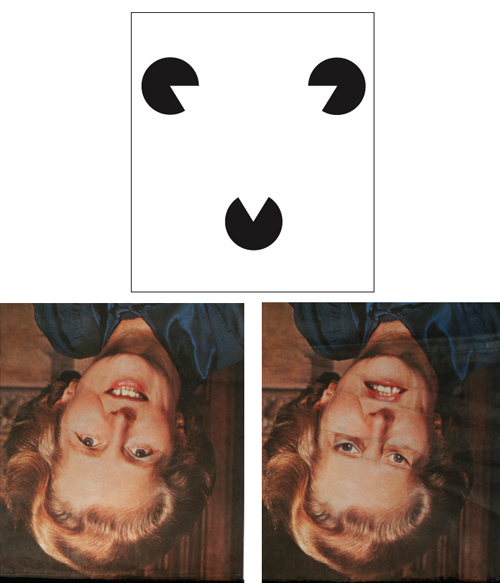
Center and right images from P. Thompson, Perception, 1980.
It is easy to appreciate how powerful visual intelligence is when we realize that computer scientists who work in the field of artificial intelligence have been trying to devise automated face-recognition systems for many years. In spite of the availability of powerful computers, the accuracy of these systems, when compared to human observers, remains poor.
To a human’s visual intelligence, the solar corona presents a task as challenging as that of recognizing faces. With its extraordinary dynamic range in brightness, and the presence of low-contrast structures (characterized by slight but abrupt changes in brightness), the complex coronal plasma is unlike anything else our eyes have ever seen. Visual intelligence evolved for survival, not to study the corona. Its priority is to determine what is there, and given the circumstances, it selects its favorite trick: adapting to emphasize difference, change or contrast. The brain quickly accommodates to static stimuli, only noticing when something is altered. How do we know this is happening with the human view of the corona? By relating how the corona is imaged to how it is seen.
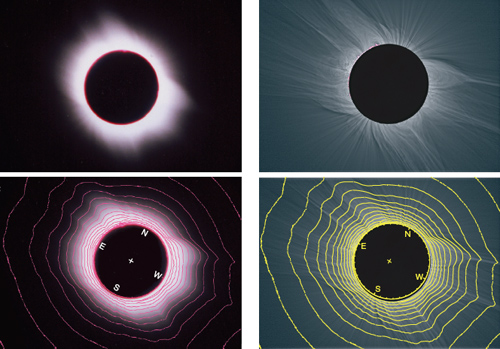
Courtesy of AAS, from R. Woo and H. Druckmüllerová, 2008.
Quantitative measurements—and images that are produced from them—are merely different representations of the same observation, so relating the two is essential for understanding the image. Contours, or curves, of constant brightness are known as isophotes. These contours have been constructed from quantitative measurements and superimposed on the unprocessed image of the corona (see Figure 5). The isophote closest to the boundary of the corona follows the shape of the corona, reinforcing what we already know, that the perceived shape of the corona is determined by the threshold sensitivity of the imaging instrument. In stark contrast, superimposing the same raw-image isophotes on the processed picture shows conspicuous departures from its brightness, the most striking being the reduced brightness in the polar regions of the Sun. What is the reason for this disparity?
Adapted from D. J. McComas, Geophysical Research Letters, 1998.
The difference in the processed image stems from the removal of an average density falloff, which coincidentally takes place when radial density gradient filters are used or multiple pictures of varying exposures are combined. Because the radial falloff is steeper in the polar than equatorial region, subtraction of an average falloff produces a deficit of brightness in the polar region and an excess of brightness in the equatorial region. The shape of the corona is still determined by the threshold sensitivity of the imager, but now it is the threshold of the differenced density rather than the density measurements. The shape is jagged because the latitudinal variation in the radial falloff of electron density is exaggerated in the differenced-density measurements. The additional computer enhancement of density gradients brings out the small raylike structures.
Without realizing it, eclipse scientists were mimicking the differencing processes of visual intelligence used by the human brain. This explains why the processed images of the third period of eclipse study are reminiscent of the corona captured in the hand-drawn sketches of the first period. They are different from the unprocessed images of the second period because, as with the naked eye, the processed images represent differenced density rather than density. As they are artifacts produced by the differencing process, the large-scale monolithic structures of processed pictures do not exist physically in the corona.
The intervention of visual intelligence or psychological perception in the study of the corona brings to mind similar circumstances in the study of Mars. During much of the period of human fascination with Mars that preceded the era of space exploration, attention was directed toward a controversy over its “canals.” These were discovered in 1877 by Italian astronomer Giovanni Schiaparelli, who observed a dense network of linear features on the surface of Mars. He named them canali in Italian, meaning channels, which was mistranslated into English as canals. This incorrect translation made a conceptual difference, because canals suggested an artificial construction and the possibility of intelligent life on Mars, whereas channels might have connoted more natural configurations of the land.
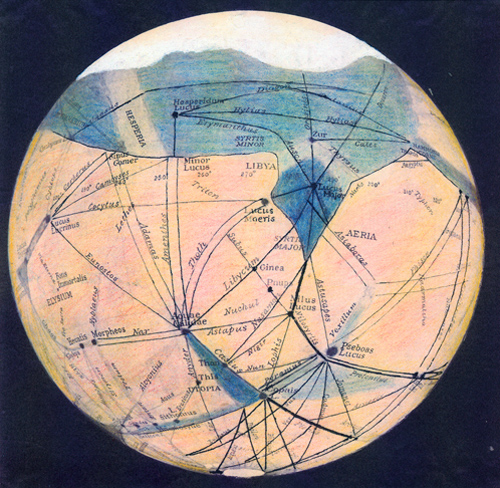
In the early 1900s American astronomer Percival Lowell became the most fervent supporter of the artificial-canals viewpoint and spent most of his life trying to prove the existence of intelligent life on Mars. But the popular concept of Martian canals was controversial, and later the prevailing view was that they were an optical illusion. In 1913, Greek astronomer Eugène Antionadi wrote:
“Ponderous volumes will still be written to record the discovery of new canals. But the astronomer of the future will sneer at these wonders; and the canal fallacy, after retarding progress for a third of a century, is doomed to be relegated into the myths of the past.”
Visual intelligence is continuously trying to find patterns, something it is notoriously good at doing. It has a tendency to construct lines joining neighboring points where no intrinsic linear features exist, as demonstrated in the illusory triangle made by three cut-out circles of the Italian artist-psychologist Gaetano Kanizsa (see Figure 4). The Martian canals remained in the public mind throughout the first half of the 20th century, but with the diminished credibility of visual observations, research on Mars would not recover in stature until the space age, when close-up imaging by the Mariner spacecraft in the 1960s finally put the notion of canals on Mars to rest.
Writing in 1966, Carl Sagan expressed his opinion on the damage done by the canal controversy to Mars research:
“It became so bitter and seemed to many scientists so profitless, that it led to a general exodus from planetary to stellar astronomy, abetted in large part by the great scientific opportunities then developing in the application of physics to stellar problems. The present shortage of planetary astronomers can be largely attributed to these two factors.”
Solar research benefited greatly from technological developments of the 20th century. In 1908, solar astronomer George Hale showed that sunspots are regions of intense magnetism. His discovery prompted extensive measurements of the magnetic field at the surface of the Sun known as the photosphere. Collected by ground-based observatories and instruments in space, the results suggested that the link between the Sun and its atmosphere is through the solar magnetic field.
In the 1930s, Bernard Lyot invented the coronagraph, a telescope that simulates solar eclipses by occulting the Sun, making it possible to image the corona between eclipses. Coronagraphs—both on the ground and carried by space missions, such as the Solar and Heliospheric Observatory (SOHO) and the Solar Terrestrial Relations Observatory (STEREO)—have made continuous observations of white light possible. They enable astrophysicists to track from the Sun the propagating disturbances or coronal mass ejections that are related to solar flares and geomagnetic storms, and are the source of space weather. The latter is familiar to most of us because of its potential to shut down power grids, disable satellites and disrupt cell-phone communication.
In the early 1960s, the advent of space exploration brought confirmation of a remarkable prediction by theoretical solar physicist Eugene Parker. The corona—composed mostly of plasma, ionized gas comprising both protons and electrons—was not static. Instead, the solar plasma flowed outwards from the Sun, eventually reaching supersonic speeds (as fast as 800 kilometers per second) and filling our solar system. Parker named it the solar wind. Since its discovery, a flotilla of interplanetary spacecraft has been systematically exploring the three-dimensional solar wind, now also called the heliosphere. These spacecraft have been equipped with instruments to directly observe the fields and particles of the solar wind and to characterize their properties. The solar wind is now known to consist of several components of different speeds and densities.
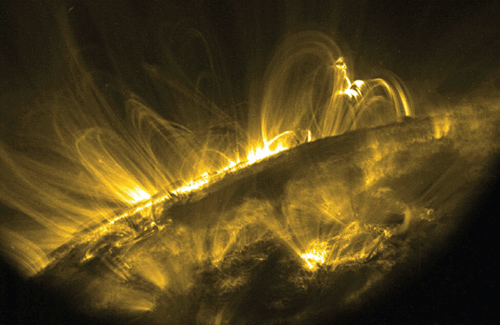
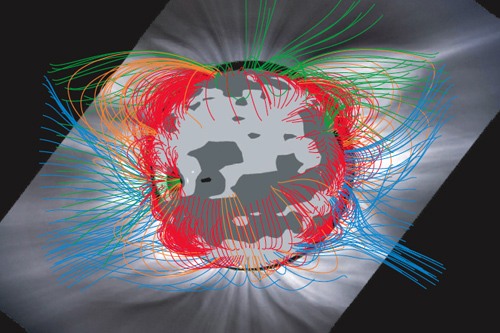
Image courtesy of Lockheed Martin/NASA.
By observing the Sun from above the terrestrial atmosphere with recent spacecraft missions such as SOHO, as well as the Yohkoh and Hinode satellites and the Transition Region and Coronal Explorer (TRACE) space telescope, researchers have been able to image the Sun’s soft x-ray and ultraviolet emissions, revealing a corona that is highly structured and dynamic. These measurements show solar regions noticeably less dense and cooler than others. Named coronal holes, they show up as dark areas in ultraviolet and x-ray images. The dark coronal holes are bounded by brighter regions collectively called the quiet Sun, which are dotted with active regions—the sites of sunspots. Coronal holes reside in the polar regions of the Sun during the low-activity portion of the solar cycle, but they disappear during solar maximum.
Although extensive on-site and remote-sensing observations have been used to explore the solar wind since its discovery, determining where it emanates from on the Sun and how it evolves with distance has been a formidable challenge. There are no direct measurements of the source region of the solar wind. Although the magnetic field is thought to have a role, we do not have remote-sensing measurements that define either the global distribution of the magnetic field or plasma flow in the corona. Faced with this dilemma, solar-wind researchers turned to clues from coronal imaging.
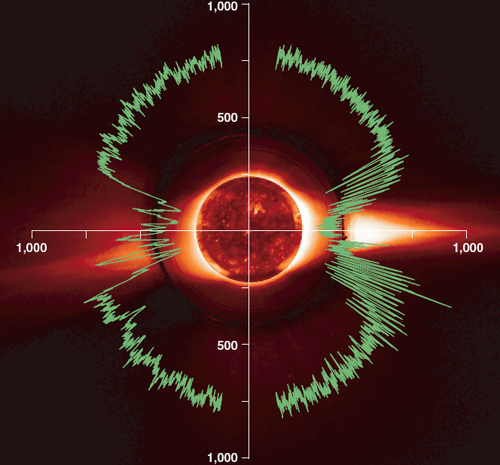
Courtesy of AAS, from Y.-M. Wang et al., Astrophysical Journal, 2007.
Like the pattern of iron filings that cluster along magnetic field lines surrounding a magnetic bar, the structure revealed in emission and processed white-light images gives the impression that it traces coronal magnetic field lines. Schoolchildren in the millions have used a compass to verify this phenomenon in the case of iron filings, but without magnetic- field measurements in the solar corona, the magnetic tracing of coronal images cannot be directly validated.
There is little doubt that the striking loops of high-resolution images of ultraviolet emission obtained by TRACE represent closed magnetic-field lines (lines that return to the Sun), but why can’t we see open magnetic-field lines (lines that extend into interplanetary space) that are more relevant to the outward flow of the solar wind? Do closed fields appear more clearly because of enhanced emission and brightness due to trapped plasma within them? What role does self-selection play in the images?
The failure to legitimize emission and white-light pictures as tracers of the solar magnetic field is a major weakness in their use in solar-wind research, but our failure to understand the processed white-light images themselves is the fatal flaw. Solar-wind velocity measurements from the Ulysses spacecraft are widely believed to confirm and illustrate the current tenets of the solar wind. In this paradigm, the fast component of the solar wind, if not all of it, originates from polar coronal holes during solar minimum before diverging into interplanetary space. Because the wind diverges instead of extending radially, its expansion is described as superradial. Superradial expansion from polar coronal holes is, however, founded on the false impression from processed white-light pictures that their large-scale features are suggestive of diverging polar coronal holes, which are in fact artifacts produced by density differencing.
This erroneous picture of the origin and evolution of the solar wind has, unfortunately, served as the basis for solar-wind studies for more than three decades. And it has been perpetuated by theoretical models that are inspired by and continue to replicate the same unconfirmed preconception and misinterpretation of processed white-light pictures. Extrapolating observations of the photospheric magnetic field into the heliosphere, they are essentially magnetic-field models. Although they have been verified with on-site measurements of the magnetic field in the distant solar wind, like the eclipse pictures themselves, they have not been validated in the inner corona.
Let us assume a hypothetical situation where the wide dynamic range of coronal brightness that makes coronal imaging difficult no longer exists; the processed eclipse image is of density and not of differenced density; coronal magnetic-field measurements are available and they legitimize the image of the corona as a tracer of the complete magnetic field; and finally, the image shows a corona with evenly distributed filamentary, radial, raylike structures. In addition, let us assume that there is another identical set of these radial structures that trace the magnetic field elsewhere, but converge at a point slightly above or below the center of the Sun.
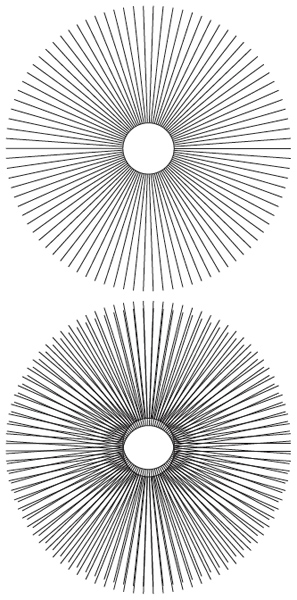
Tom Dunne
These two separate hypothetical sets of raylike structures are superposed in Figure 9. What is surprising is the spontaneous appearance of a pattern resembling a dipolar magnetic field, which becomes even sharper when the image is processed to enhance density gradients. This image is not tracing the density structure of the magnetic field, as measurements of the coronal magnetic field and coronal density would confirm. Instead, it is an optical illusion created by the interaction of neighboring repeating structures, known as a Moiré pattern and studied by biophysicist and optical-artist Gerald Oster in the 1960s.
Because canals are objects that our eye and brain recognize and are familiar with, the mistaken canals on Mars caused by visual intelligence were overcome simply by observing Mars with higher resolution.
In the case of the corona, the mistaken origin and evolution of the solar wind cannot be remedied with images, because it is not possible to obtain images of the structured corona that are free of artifacts. Furthermore, even if it were possible, inferring fields and flow from images of density is dependent on elucidating the relationship between the magnetic field, plasma flow and electron density, as well as legitimizing white-light images as tracers of fields and flow, both of which are unachievable without measurements of fields or flow in the corona. We need a fresh start with a different approach.
Plasma density is the only solar-wind parameter that has been extensively observed in both the corona (via remote sensing) and the solar wind (by on-site and remote sensing). A natural approach is to explore the expansion of the solar wind by following plasma density as the wind flows outwards from the Sun. As the isophotes in Figure 5 suggest, density seems to spread out in all directions.
When a spacecraft flies behind (or in other words, is occulted by) the corona as seen from Earth, radio signals from the craft pass through and probe the corona. Measurements of the time delay and phase changes in these signals provide information on electron density (described by the author in American Scientist, November–December 2002). Such radio-occultation measurements made with the Ulysses spacecraft have shown that the imprint of the Sun appears to be radially extended in the solar wind. These observationally robust results imply that the wind emanates from the entire Sun, rather than exclusively from polar corona holes, and that its expansion is radial.
This approach is rigorous because it does not rely on imaging. Neither does it presume a preset role for unmeasured magnetic fields. Instead, it uses density observations made with spacecraft radio signals that complement the optical measurements, on account of their extraordinary sensitivity and resolution. These radio measurements have also been instrumental in understanding structures in both the white-light and radio data. From what we now know, even if a not-yet-feasible spacecraft were sent to the Sun to make multiple passes through its inner corona, the task of identifying and disentangling the observed variations in the measurements of fields and particles would still be daunting. Unambiguously determining the source of the solar wind with on-site coronal measurements would remain a great challenge.
It was surprising to learn that we had been mistaken about the solar wind’s source and evolution after nearly half a century of exploration. But the prescient Eugene Parker recognized such possibilities. He concluded his 2001 review of the history of the solar wind by saying:
… the history of the concepts leading to our present limited appreciation of the solar wind extends back in time over 2,000 years, when space and magnetic field were first recognized. If that long history has taught us anything, it should be that human familiarity with any special field of physics is not to be taken to delimit that field of physics. Further experimental and observational efforts frequently turn up unanticipated new twists to old principles and familiar phenomena. No matter how hard or how long one has thought about a physical effect or principle, there are usually new facets to be discovered by a fresh look by someone else. That is the fascination of real science. It means that no scientist can become an ultimate expert, and no self-styled expert can operate effectively as a research scientist.
Historian and philosopher of science Douglas Allchin sees erring as science, because science is an error-correcting process. But, as he points out, error does not announce itself. Nor is error correction automatic. The solar-wind case is a perfect example: The error was discovered only through the culmination of half a century of exploring coronal density with radio-occultation measurements, and it was fixed only by clarification of the relationship between seeing and imaging the corona after investigating it during eclipses for a century and a half.
As scientific data, images have not received the same intense scrutiny routinely accorded quantitative measurements. Considerations of the suitability of images and their application, the legitimacy of the images, and technical problems caused by selection effects have been conspicuously absent. In addition, there has been a dearth of discussion regarding limitations in sensitivity and resolution for both representation and reproduction of the images, as well as the use of radial-density filters and image processing. Indeed, there is a general paucity of study of photography in science, as has been noted by science historian Holly Rothermel.
The uncritical use of images seems to be a product of the visual age we live in. Pictures are iconic, instant and influential. “A picture is worth a thousand words,” we say, and “Seeing is believing.” Vision has transformed our technological and cultural landscape, spawning spectacular movies, video games, virtual reality and other technological products. Believing is also seeing, and the availability of relatively inexpensive computers has made it easy to freely process images, and to model and produce verisimilar simulations of the preconceived—but unverified—corona.
Images can help or hurt us. Whether we employ them for scientific study or scientific representation, it is imperative that we ensure that the former always gains the upper hand, because no less is at stake than the credibility of science.
Click "American Scientist" to access home page

American Scientist Comments and Discussion
To discuss our articles or comment on them, please share them and tag American Scientist on social media platforms. Here are links to our profiles on Twitter, Facebook, and LinkedIn.
If we re-share your post, we will moderate comments/discussion following our comments policy.