The Rising Cost of Resources and Global Indicators of Change
By Carey W. King
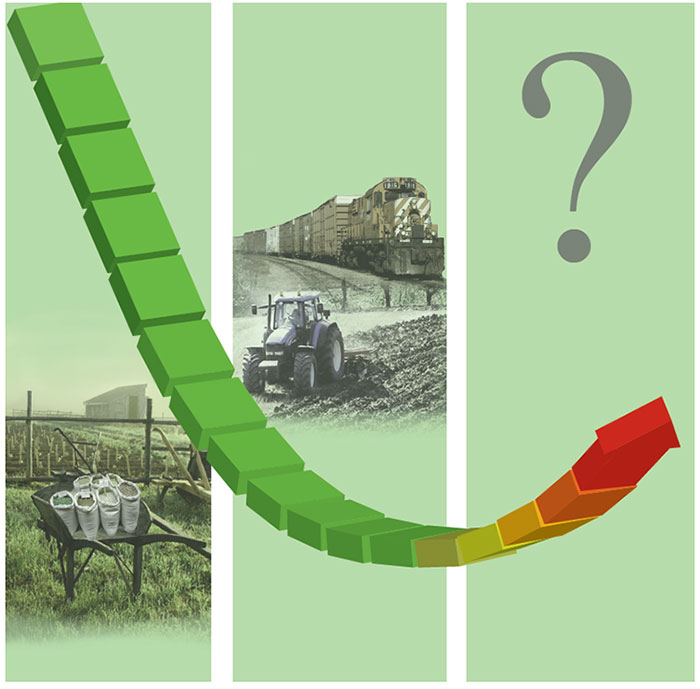
The turn of this century saw the cheapest-ever energy and food combined, and here’s why we may never return to those historic low numbers.
The turn of this century saw the cheapest-ever energy and food combined, and here’s why we may never return to those historic low numbers.

DOI: 10.1511/2015.117.410
Contemporary discussions of energy resources and technologies are full of conflicting news, views, and opinions from extreme sides of arguments. The average person is understandably confused. Depending on who you listen to, horizontal drilling and hydraulic fracturing have either placed the United States on the verge of energy independence, or exposed the insolvency of oil and gas companies as they spend more money than they collect from sales. Renewable energy technologies can either obviously serve all of our needs, or are a subsidized path to economic ruin.
In the vast majority of instances, the extreme views are hyperbole of a much more subtle reality. It is tantamount that we properly consider future energy options in the context of relevant biophysical and socioeconomic trends. Otherwise, we risk merely treating symptoms of the true underlying causes.
One approach to a deeper understanding of energy, particularly for the general consumer, is to put the numbers into practical context. For instance, here’s an essential takeaway shown by my recent data analysis: The turn of the 21st century marked an important societal turning point, as the time of the cheapest food and energy the world has ever known.
For developed countries, and likely the world overall, the trend of increasing food and energy services consuming a declining proportion of our economic output (in terms of gross domestic product, or GDP) seems to be over, perhaps permanently. The implications for future economic growth and social relations are extremely important, particularly as we come to grips with the slow rates of growth that continue to define the current world economy.
It is practically impossible for us to significantly alter many of the long-term causes of energy and food cost trends. As a consequence, the ability of our energy system to aid in the achievement of environmental and socioeconomic goals lies primarily in using technology to consume less energy and deal with the obvious: Earth is a finite planet.
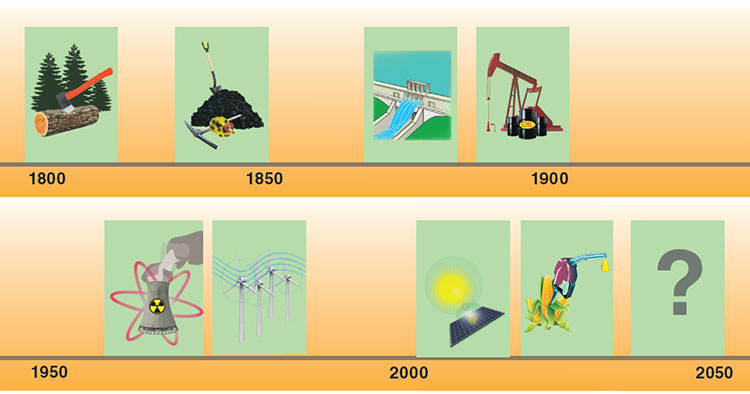
Consider the world more than 200 years ago, before industrialization and the pervasive consumption of fossil fuels. In this world, biomass (firewood, for instance) and food were the dominant fuels. Food and fodder powered the main prime movers of society (and still do for many parts of the developing world): human and animal muscles working the land. Wind and water mills made important use of renewable sources, but biomass stocks drove most of society. Thus, for a long-term perspective, we must consider food as part of the world’s energy supply.
How do we measure whether energy is cheap? Many people think prices determine if something is cheap versus expensive: how many dollars for a gallon of gasoline, how many cents for a kilowatt-hour of electricity. However, tracking energy prices tells only half of the story. The other half is how much food and energy people actually purchase. Prices are the signals that inform what we consume, but they alone do not tell us how much we spend in total.
Thus, it is useful to measure the energy-food cost share as total expenditures (price×consumption) on food and energy relative to GDP (and also as a percentage of personal income). The lower the energy-food cost share, the easier it is to attain basic needs, and the more money is available for invention and consumption of discretionary goods, services, and industries (such as movies and vacations). Of course, if the energy-food cost share increases, then the opposite is true.
Economic historians have collected data to estimate energy expenditures going back more than 100 years. Data assimilated by Roger Fouquet (for the United Kingdom and England back to 1300) and Astrid Kander (for Sweden back to 1800) provide insight into the energy cost trends during the transition to the fossil fuel era.
In the United Kingdom, only after 1830 did energy expenditures relative to GDP drop below 20 percent, and in Sweden only after 1920 (largely because cheaper coal was adopted later). The cheapest energy in the United Kingdom’s history was in the mid-2000s, and the Swedish data indicate a flat energy cost share from the mid-1980s to 2000. Developed world energy costs have been less during the past 100 years than the prior 600.
Developed world energy costs have been less during the past 100 years than the prior 600.
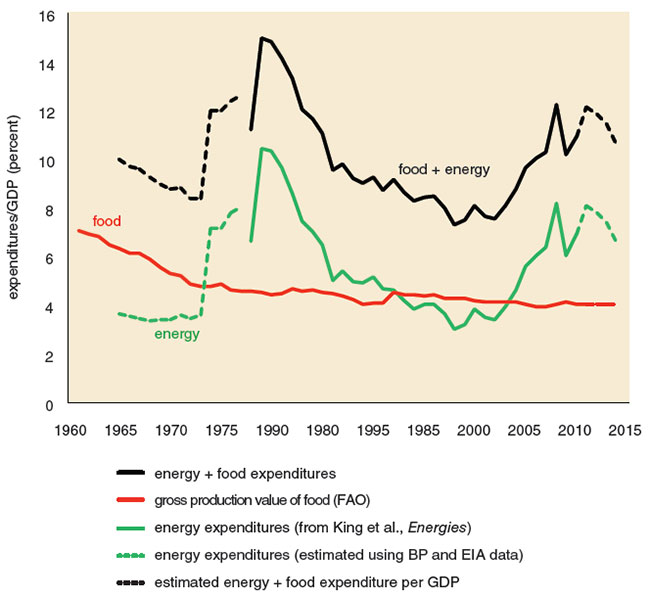
The United States Bureau of Economic Analysis maintains a shorter time-series that shows the same pattern of declining energy and food costs for the United States. The share of GDP allocated to U.S. consumer food and energy purchases declined for 70 years until 2002. After that year, energy and food became more, not less, expensive.
Considering world energy (not including food) expenditures since 1978, the minimum was around 1998, predominately because of extremely low oil prices at that time. World expenditures for food production have also stopped decreasing over the past decade. Combining world energy and food expenditures data shows that the world trend of energy and food costs as a share of GDP reached its minimum around the year 2000. Thus, considering the more than 200-year trends of the United Kingdom and Sweden, the 70-year trends of the United States, and the 30-year trends for the world, the data support the finding that the turn of the 21st century marked the cheapest energy and food in history, but are now reversing that long-term course and trending upward.
Stein’s Law, named for economist Herbert Stein, states: “If something cannot go on forever, it will stop.” Applying Stein’s Law to declining food and energy cost shares implies they cannot decline eternally, unless energy and food become free and/or GDP grows to infinity, neither of which are likely on a finite planet. There are several driving factors that make it unlikely that the world will reverse its recent course and pay less for food and energy than that already achieved around the turn of the century.
One driving factor is population. Living populations grow exponentially until they reach constraints. A decreasing population growth rate is a natural system response to negative feedbacks from diminishing returns on increasing the population within finite space, time, and resource inputs. United Nations (UN) data show that post-World War II world population growth rate peaked in 1968 and has been slower every year since. In other words, the cost-benefit ratio of having children is decreasing because of inherent constraints of a finite planet. However, the population is still growing, and a larger overall population requires more food and energy production and distribution, with all other factors held unchanged. Because energy and food expenditures per GDP bottomed out around 2000, this makes it more costly to maintain this larger population.
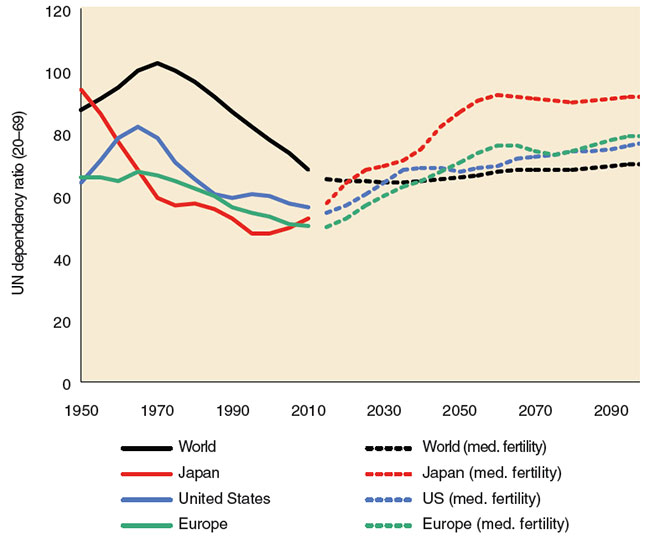
Further, as populations slow their growth rates, they get older. UN projections indicate that 2010 is characterized by a minimum in the dependency ratio, an estimate of the non-working fraction of the population divided by the working fraction of the population. Thus, the smaller the dependency ratio, the easier it is for workers to support non-workers (those too young or too old to work). Since the 1960s, worldwide the number of working-age people has been growing faster than the number of dependent persons. Going forward from 2010, the opposite trend will hold. In the 1990s Japan was the first industrialized nation to struggle with this change in demographic trend. Europe and the United States are experiencing the change now.
Just like with population, as we have slowed the expansion of our energy infrastructure, it has also become older. I have calculated a dependency ratio for U.S. electric generation equal to the fraction of total capacity that is older than a certain age (for instance, 40 years) divided by the fraction of total capacity younger than that same age. We have never had an older fleet of power generation assets than today. Since the late 1970s, we have relied more and more on older power plants.
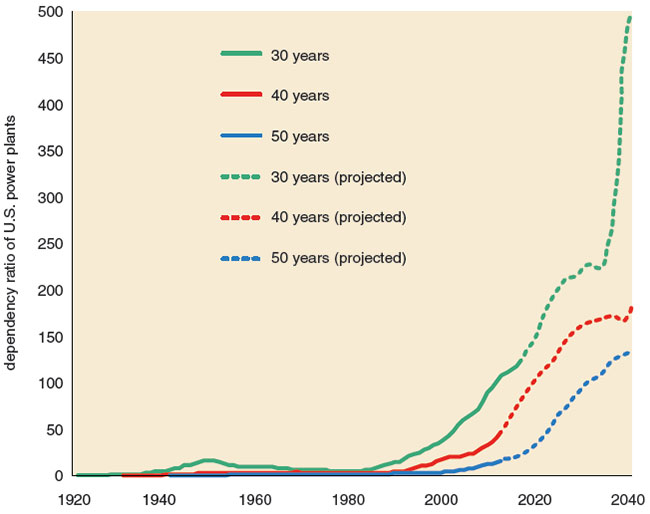
The Energy Information Administration’s projection for new power plant installations indicates that the U.S. power plant fleet is expected to continue to get older. Power plants do not last forever, and they require maintenance. If we want to have more total generation capacity, we have to install new capacity faster than the existing capacity retires. Increasingly, maintaining and replacing power plants just to keep total capacity at the same level takes resources that have historically been allocated to accumulating more capacity in total.
In addition to having an older power generation fleet, the U.S. is no longer consuming more electricity. Just like the diminishing returns to increasing the population, we have diminishing returns to increasing electricity consumption and generation capacity. Because overall U.S. demand for electricity is constant (in some states demand is declining, fewer states increasing), the incentive for installing new power plants is small. The solutions then become to invest in smaller rather than larger increments. Hence recent investments have focused on energy efficiency, demand response, and smaller capacity natural gas, wind, and photovoltaic plants instead of larger coal-fired and nuclear power plants.
Although an older energy infrastructure requires more repair, maintaining the energy infrastructure and producing energy requires energy itself as an input. Because we’re spending more on energy overall since around 2000, this balancing act presents a conundrum. Our marginal energy supplies themselves are becoming more expensive, so we increasingly need more energy input to produce the same energy output from new resources.
As an example, consider the oil sands in Canada. During the past decade this resource became an economically viable energy reserve. Oil sands are significantly more expensive to produce than conventional oil, in that a lot of energy must be used to create steam that is injected underground to extract the bitumen. For every unit of energy input into oil sands production, less than 6 units of energy come out in the extracted bitumen. The U.S. oil and gas industry historically produced 10 to 20 units of energy relative to a unit of energy input. Considering the additional energy inputs for refining the oil to products such as gasoline and jet fuel, oil sands deliver less than 3 units of energy, whereas historically gasoline delivers between 5 and 10.
The lower this energy input/output ratio, the higher the energy cost. And this equation also largely governs which energy sources can be produced economically. Right now, sources such as the kerogen oil shale of the Piceance Basin in Colorado have a ratio too low for production. Unfortunately, many biofuels also have ratios that are too low (aside from southeastern Brazilian sugarcane for ethanol and electricity), and all suffer from limitations in productive land and climates. But can we become more efficient to enable consumption of such higher cost fuels?
One general response to increased costs is to become more efficient in the use of resources, both in terms of energy and capital. But in 1865, British economist William Stanley Jevons noted that technological improvements that increased efficiencies of energy use often caused industries to raise their energy consumption. Because of this rebound effect, also called the Jevons paradox, efficiency can help to promote growth that would otherwise not occur. So efficiency is a good cure for lack of growth.
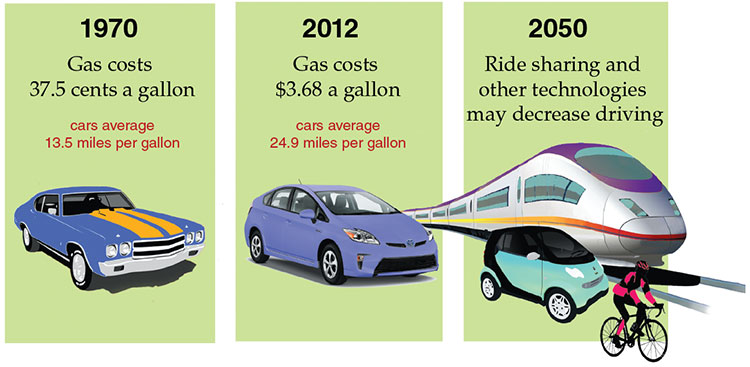
Consider car fuel efficiency standards. In 1970 Americans drove their cars (with an average fuel use of 13.5 miles per gallon) and trucks (10 miles per gallon) for 1,035 billion miles, consuming 80 billion gallons of fuel. With gasoline at an average of 37.5 cents per gallon at the time, fuel costs were $27 billion, or 2.7 percent of GDP. In 2012 the numbers were 24.9 and 18.5 miles per gallon for cars and trucks, respectively, collectively driving 2,665 billion miles to consume 124 billion gallons of fuel. With gasoline at $3.68 per gallon, fuel costs were $457 billion or 2.8 percent of GDP. It is not a coincidence that fuel costs were practically the same, relative to GDP, in 1970 and 2012: Consumers adjust their habits to available technology and energy prices. If car fuel economy had not increased, Americans certainly could have afforded to drive only a fraction of the 2.7 trillion miles driven in 2012.
Today, the full cost of car ownership (payments, fuel, parking, and so on) is increasingly beyond, or unnecessary for, the urban Millennial generation, who will soon reach the peak driving ages of 35 to 54. Millennials have already influenced the 16 to 34 age demographic, driving 23 percent fewer miles from 2001 to 2009 than previous generations had done. Overall demographics are additionally pointing to less driving (older people drive less, and our population is aging). Student debt, crowded cities, and social media, amongst other factors, collect into “complex adaptive” changes within the U.S. socioeconomic system that lead to reduced driving. As the U.S. PIRG Education Fund reported in 2014, these changes indicate most driving forecasts are overly optimistic.
Millennials appear to be increasingly turning to car and ride sharing, examples of disruptive combinations of technology that can get around socioeconomic limitations. The services provide less transportation convenience than owning your own car and garage, but at significantly reduced costs and more efficient use of existing car capital. Thus, they are attractive services with enough grassroots support that it is too difficult for politicians to halt them on behalf of vested interests in the status quo (such as taxi services).
An additional factor in the distribution of consumption relating to energy is inequality, both within and between countries. The oil crises of the 1970s forced the developed Western economies to react, for the first time, to the fact that they do not fully control Earth’s finite resources. Other populations could make decisions affecting Western lifestyles. The United States no longer had increasing quantities of cheap oil of its own to pay down debts (such as from the Vietnam War) and provide a middle-class lifestyle.
Income and wealth inequality have become central topics since the Great Recession and Financial Crisis that began in late 2007. Per-capita income and energy consumption largely go hand in hand. A person who has more income consumes more energy both directly (fuel and electricity) and embedded in products (consumer purchases). From 1950 to 1980 the United States and Western Europe achieved historically unprecedented high levels of income equality. Cheap energy and distributive policies gave the American middle class easy living. French economist Thomas Piketty puts into perspective the wealth equality in the several decades after World War II, pointing out that it was uniquely high because so much wealth was destroyed in the wars. In other words, rich people got poorer; poor people did not get richer.
The developed economies have become decidedly less equal in income and wealth distribution since 1980 because of changes in domestic policies (such as lower taxes on capital and less benefits for labor) and globalization forces. Physicist Victor Yakovenko at the University of Maryland has calculated that from 1980 to 2010, the distribution in power consumption per capita between countries has shown increased equality. The same holds for income. Developing countries benefitted from declining equality in developed countries as manufacturing globalized. Americans now need two-income households to maintain the incomes from the 1970s, but Asians obtain higher incomes from working in new manufacturing and services jobs. Considering developing countries specifically, economist Martin Ravallion at the World Bank recently showed that total inequality (adding inequality between countries to inequality within countries) decreased from 1980 to 2005. Perhaps not coincidentally, developing country inequality then increased from 2005 to 2010 along with food and energy prices.
If inequality in developing countries is no longer decreasing, and developed economy households have had increasing income inequality for the past several decades, then how can consumption increase? Maybe we can just borrow to increase consumption. As economists Carmen M. Reinhart and Kenneth Rogoff state in their 2009 book titled This Time is Different: Eight Centuries of Financial Folly, “Financial crises seldom occur in a vacuum.” The global financial crisis that started in 2007 was no exception. It occurred in an atmosphere of economic ignorance about the influence of debt and the dependence of the economy on biophysical resources within the environment.
The low-point of energy-food cost share and an aging infrastructure are shocks over demographic time scales of hundreds of years.
Reinhart and Rogoff point out that usually a real system shock occurs and then financial feedbacks react to and amplify the situation. Although not viewed as a “shock” as typically defined by economists, both the low-point of energy-food cost share and the dependency ratio for an aging energy infrastructure are shocks over demographic time scales of hundreds of years.
From 2000 to 2007 global debt increased from 246 percent to 269 percent of GDP, primarily due to household and financial sector debt, according to a 2015 McKinsey Global Institute study. In the early 2000s economic expectations were high based upon globalization and the Internet, both leveraged on cheap energy and food. As a result, Americans acquired home mortgages and borrowed against expected future rises in housing prices. The banks knew the mortgages were unaffordable but they were incentivized to pocket lending fees as long as the party lasted. It only became apparent to the developed world in 2007 that China’s pressure on increasingly scarce natural resources had increased prices to such an extent that it trumped the developed world’s debt-financed expectations.
Then from 2007 to 2014, global debt increased from 269 percent to 286 percent of GDP, a slower rate than the previous seven years, but this time driven by increases in public debt, as governments have attempted to come to the rescue by buying losing assets from private investment banks and insurers. Unfortunately, such monetary policy measures do not affect the real economy with biophysical constraints, which is where food and energy prices exist, and global debt continues to grow faster than GDP.
Lowering interest rates is the major tool of the central banks to try to entice economic growth by making it cheaper to borrow money. Countries have had high debts and energy prices before, but today central bank interest rates are lower than at any time in the history of central banking. Central bank rates historically average about 5 percent. However, the rates of the Federal Reserve, the Bank of England, and the Bank of Canada have been less than 1 percent since 2009. The rate at the Bank of Japan has been below 1 percent since 1996.
Interest rates near zero leave no room to maneuver downward, and the Central Banks then began a policy called quantitative easing, where they buy government bonds from the banks, to reduce the risk from banks holding poor quality assets. The theory holds that the banks will then be more willing to make new loans. The problem with this approach is that the process actually works in the opposite direction. Banks make loans, creating money, when businesses are confident that consumers can buy their products. Inequality and consumer debt have become so high that the average consumer doesn’t have enough money to buy much more of anything. Thus, even though borrowing money is cheaper than any time in the modern industrial era, present expectations about future growth are too low and uncertain for businesses and consumers to borrow anew. But many believe now is the perfect time for investments with a new purpose.
To many the answer is clear: We should borrow the cheap money today to create the low-carbon economy of tomorrow. Decarbonizing our energy system is controversial for a multitude of reasons, but they boil down to disagreement on the costs versus the benefits. Internalizing CO2 emissions from fossil fuel combustion increases the direct cost we pay for energy. That is to say it makes fossil energy more expensive; it doesn’t make renewable energy cheaper. For electricity generation, a price or tax on CO2 emissions directly raises the cost of natural gas and coal power but only to a much lesser extent (and indirectly) for nuclear, wind, and solar power that generate no CO2 emissions during operation.
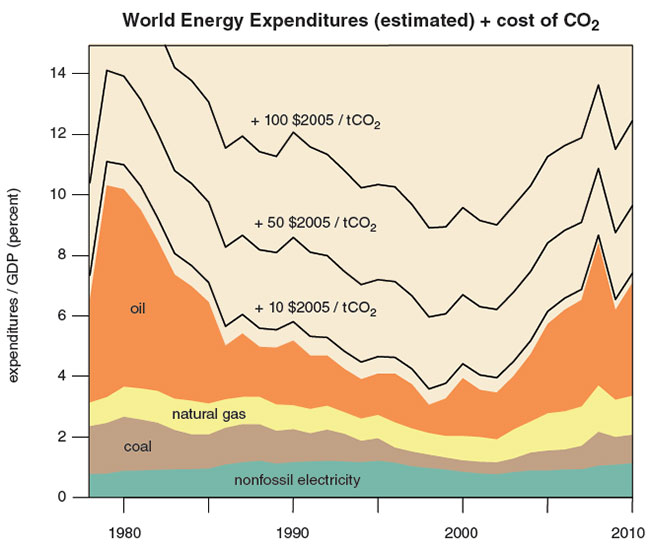
Consider that major recessions have coincided with high energy expenditures relative to GDP (such as the 1970s and 2007–2009). Adding CO2 expenditures to energy only increases “energy + CO2” expenditures. If there is a limiting percentage of GDP that can be spent on “energy + CO2” before coinciding with and/or causing recession, then as energy expenditures rise, CO2 market prices, and thus expenditures, should fall. This outcome has been exactly the response in the European Trading System carbon price. European Union officials assumed that the economy would always grow such that the carbon emissions market price would rise to induce new low-carbon investments. An alternative scenario has emerged since 2008, in which the exact opposite has happened: A no/low-growth economy has induced a low carbon price instead of a high growth economy inducing a high carbon price.
This energy and CO2 tango raises a question of priorities: Will countries target the needed CO2 emissions reductions if their economies are already shrinking or stagnating? Many studies predict that an emissions penalty (in other words, a tax or price on emissions) of $50-$100 per ton of CO2 would incentivize transition to a low-carbon economy. However, even at the time of cheapest energy in history (1998–2002), such a price would have caused the world to spend about 7 to 10 percent of GDP on primary “energy + CO2” (not including food). The only comparable time period of the past 100 years with world energy expenditures at that level was 1979–1980, when OPEC production dropped by more than 8 million barrels of oil per day (13 percent of world production at the time) because of the Iranian revolution and subsequent conflicts. As a result, oil prices spiked and the developed world was plunged into recession. Thus history shows that there is great delicacy needed to balance economic growth and opportunity against the environmental benefits of decarbonization.
First we provide energy for our own bodies, then once that need is fulfilled, we use any excess energy to operate and possibly grow what we call “the economy.” For 200 years we have increasingly used higher energy density and cheaper energy alternatives (and used them cleaner). Since around the year 2000, this trend has not happened. Energy technologies continue to advance (for example, photovoltaic solar panels, or hydraulic fracturing for oil and gas), yet for the past 15 or so years we have paid more, not less, for food and energy.
Because world primary energy consumption is still more than 80 percent fossil energy, the increase in energy expenditures since 2000 is largely from those sources. Even though 2015 has seen significantly lower oil prices than 2010–2014, expenditures remain higher than 1998–2002. In an increasing number of locations, the marginal installation of renewable electricity technologies such as solar and wind is now cheaper than fossil fuel options. Thus, some authors argue that we can easily and affordably substitute renewable energy technologies that extract energy flows (such as sunlight, wind, or waves) for ones that extract and convert fossil energy stocks. By no means have we yet come close to any engineering or resource limits of the integration of modern industrial renewable energy. But it is one thing to state that wind and solar are competitive today for installing the next power plant; it is another to state that a 100-percent renewable energy world will enable us to spend the same low fraction of GDP on energy and food while living our current developed world lifestyles.
The world is not flat, and it is not infinite, either, no matter how much various economic models and pundits might imply. The fraction of GDP spent on food and energy is a system-wide indicator that is itself a function of multiple feedbacks within our complex world. To date, human ingenuity in the use of fossil fuels has enabled us to fill the planet with ourselves and our wastes. We increasingly have to deal with the reality that we are naturally reaching diminishing returns to maintaining our populations, energy infrastructure, and our planet. We have, and we will, continue to develop innovations in our food and energy systems, but we must be humble in what we expect to achieve. If sustainability is defined as a three-legged stool—with one leg each of equity, economy, and environment—it is possible that the future world could be balanced on such a stool, but perhaps we’ll have to consider lowering the longest leg(s) in addition to raising the shortest.
Click "American Scientist" to access home page

American Scientist Comments and Discussion
To discuss our articles or comment on them, please share them and tag American Scientist on social media platforms. Here are links to our profiles on Twitter, Facebook, and LinkedIn.
If we re-share your post, we will moderate comments/discussion following our comments policy.