Richard Feynman's Diagrams
By Felice Frankel
The Caltech physicist's famously elegant figures in quantum electrodynamics replaced dense lines of algebra with intuitively accessible "pictures" of an invisible world
The Caltech physicist's famously elegant figures in quantum electrodynamics replaced dense lines of algebra with intuitively accessible "pictures" of an invisible world

DOI: 10.1511/2003.32.450
As our readers know, Sightings intends to bring attention to the power of visually communicating ideas. Although I do not pretend to completely comprehend all of the thinking represented in physicist Richard Feynman's diagrams, I continue to be fascinated by his attempts to find the essential visual representations of complicated ideas. I've asked David Kaiser to help us understand Feynman's thinking. David is the Leo Marx Assistant Professor of the History of Science in MIT's Program in Science, Technology, and Society, and a lecturer in the Department of Physics. He completed doctoral degrees in theoretical physics and the history of science at Harvard University. He is the author of two dozen research articles and editor or co-editor of six books on the history of modern physics. His book Drawing Theories Apart: The Dispersion of Feynman Diagrams in Postwar Physics is forthcoming from the University of Chicago Press.
American Physical Society
F. F. Can you give us a historical perspective on when and why Feynman began his drawings?
D. K. In the early days of quantum electrodynamics (QED) in the 1920s and 1930s, calculations were notoriously convoluted, the algebra often spilling over seven and eight lines just to calculate a single quantity. Worse, these nasty calculations almost always returned infinity, even when physicists asked straightforward questions. After the war, a new crop of young theoretical physicists, including Feynman, returned to QED and its problems. He decided first to try to take charge of the algebraic morass, streamlining the laborious algebraic manipulations, before worrying about the mysteries of the infinities. And so he began his doodlings in the late 1940s.
F. F. Would you say that Feynman was a visual thinker? Do you think his visual approach to these diagrams gave him insight into thinking about these invisible worlds different from his colleagues who worked only with numbers?
D. K. Feynman was definitely a visual thinker—no question about it. In most of his articles during this period, he made it clear that he was introducing handy calculational approaches rather than rigorously derived results. In fact, he often emphasized up front that many of the results he was reporting had not yet been rigorously derived, and that perhaps they couldn't be (at least not by himself). Yet he hardly had less faith in them for all that—he had other reasons for finding his results "physically plausible," and often those plausibility arguments hung on his intuitions and imagery. Not all physicists thought the same way then, nor do they today. Many physicists who were active during the 1940s and 1950s report having great difficulty following Feynman's papers, precisely because they tended to think in terms of starting principles followed by derived consequences, whereas Feynman almost never organized his papers that way. Others found his intuitive explanations, which usually relied on visual imagery (whether pictured or described in words), to be much easier to follow than the more abstruse mathematical deductions of other physicists like Julian Schwinger.
F. F. How was Feynman's view of his drawings different from his colleagues'?
D. K. To Feynman, the diagrams showed what really happened in the quantum-mechanical world. Beyond a mere calculating trick, he came to see in the lines of his diagrams a patchwork of comings and goings on the microlevel, particles careening to and fro as they marched through space and time. Other physicists developed different interpretations. Freeman Dyson, who did more than anyone to promote the use of the diagrams, always emphasized their quantitative features. Schwinger avoided the diagrams altogether, sniffing later that Feynman's stick-figures had brought "computation to the masses." Yet Feynman's diagrams have flourished among physicists for all kinds of uses in the last half-century.
F. F. There seems to be suggestion of symmetry in the diagram at left. Am I reading too deeply into the forms, or do you think the symmetry is important?
D. K. Symmetry was an important element in using the diagrams, but, perhaps ironically, Feynman and others had to use many words to explain some of the relevant symmetries that might be obscured by this diagram. One big point was that the order of events could occur differently than pictured, and all of these possibilities had to be included on an equal footing. So in fact the equation that this diagram stood in for had more symmetries built into it than the diagram itself seemed to portray. Feynman, Dyson and others worked hard to make sure physicists understood that feature.
F. F. The elements seem to be lying in a particular two-dimensional space. But electron scattering occurs in three dimensions and over time. What do you think?
D. K. Of course trying to draw events unfolding in four dimensions (one temporal and three spatial) would be impossible on a sheet of paper, and even incorporating one additional spatial dimension in the line drawings would make them much more cumbersome to draw or to read. In drawing their Feynman diagrams, physicists followed the pictorial conventions that had been worked out decades earlier by people like Hermann Minkowski, who had similarly struggled to work out convenient two-dimensional line drawings to aid in making calculations with Einstein's special relativity.
F. F. Would you say that diagrammatical thinking is unusual in the physics community?
D. K. I don't think that it's unusual, but neither is it universal. For example, some cosmologists rely on two-dimensional line drawings (such as Penrose diagrams) to sketch out the causal structures of exotic spacetimes; others eschew these pictures and work more exclusively with the equations of Einstein's general relativity. Some physicists find Roger Penrose's diagrams "intuitive," familiar and helpful, whereas others see only criss-crossing diagonal lines whose physical "meaning" seems too difficult to extract, and so they rarely bother with them. Physicists employ many different types of thinking when broaching research questions.
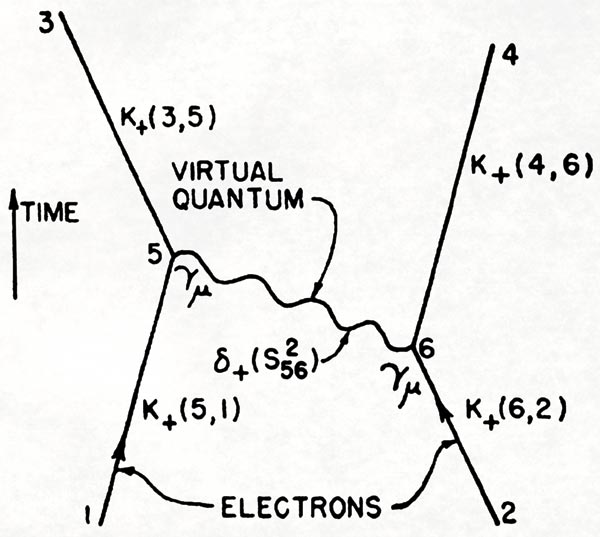
Full image caption: An electron has a certain likelihood of traveling from one place—call it x1—to another—say, x2. Richard Feynman introduced a handy abbreviation for this process: K+(2,1). Similarly, a photon, or quantum of light, has a certain likelihood to travel from one place to another, which Feynman abbreviated δ+(s2), where s represents the distance traveled in space and time. Finally, electrons have a certain probability of emitting or absorbing a photon, which Feynman could write down as eγμ (where e is the electron’s charge). He conceived this diagram to illustrate what might happen when one electron approaches from the bottom left, the other from bottom right. The electron on the right could shoot out a photon. Having given up some of its energy and momentum, that electron would recoil. Next the photon would smack into the other electron; on absorbing the photon’s energy and momentum, this electron would careen off toward the upper left. This series of events corresponded to a specific element in Feynman’s calculation:

Yet as Feynman knew well, this was only the start of his work. The power of his diagrammatic technique came in the imagining of other permutations of the process. Even at the next-simplest level, there are nine distinct ways in which the electrons could fire two photons back and forth, each corresponding to several lines of algebra yet each also reducible to a modification of the simple diagram. This diagram first appeared in Feynman, R. P. 1949. Space-time approach to quantum electrodynamics. Physical Review 76:769–789.—David Kaiser
Click "American Scientist" to access home page
American Scientist Comments and Discussion
To discuss our articles or comment on them, please share them and tag American Scientist on social media platforms. Here are links to our profiles on Twitter, Facebook, and LinkedIn.
If we re-share your post, we will moderate comments/discussion following our comments policy.