
This Article From Issue
November-December 2011
Volume 99, Number 6
Page 490
DOI: 10.1511/2011.93.490
As the need to conserve energy grows more urgent, researchers are pushing to invent better tools to get the job done. At Massachusetts Institute of Technology (MIT), the Field Intelligence Laboratory has created a mobile system to diagnose wasteful thermal leaks in multiple buildings at a time. At the heart of the system is an improved longwave-infrared imaging device, a sophisticated data collection system and some very specialized software. As a proof of concept, the project created a first-of-its-kind energy map of thermal leaks throughout the six square miles of Cambridge, Massachusetts. Jonathan Jesneck , a research scientist, and Long Phan, a doctoral candidate, are key researchers in this enterprise. Jesneck holds a Ph.D. in biomedical engineering from Duke University and specializes in large-scale computational projects useful in everything from real estate to drug discovery and medical imaging. Phan, a mechanical engineering Ph.D. student, in his first career pioneered algorithmic and proprietary trading on Wall Street. In a written exchange, they described the new system to American Scientist Associate Editor Catherine Clabby.
Ad Right
A. S. What inspired this technology?
J. J. and L. P. MIT Mechanical Engineering professor Sanjay Sarma developed the concept of mining negawatts, or negative watts. This involves identifying wasted watts and harvesting them efficiently. It’s always better to save negawatts rather than build a new power plant to make more watts. Professor Sarma recruited us to MIT’s Field Intelligence Lab to begin pioneering innovative techniques to identify and quantify negawatts in a high-throughput, noninvasive manner. On average, buildings lose, through leakage, 25 percent of the energy they consume. Longwave-infrared imaging allows one to “see” the radiant energy leaks in wavelengths of 8,000 to 14,000 nanometers, where radiant energy is most dominant.
A. S. What innovations make the system possible?
J. J. and L. P. Longwave-infrared-imaging devices have started to come down in price, but some of the best commercial imagers can cost up to $40,000 and deliver resolution as poor as a simple webcam. To address the low-resolution problem, Professor Sarma’s laboratory pioneered a technology called Kinetic Super Resolution (KSR). The team sees this technology as chip-capable, meaning one day it can likely be embedded into a camera system. KSR can improve an imaging system’s native resolution by an order of magnitude by combining multiple frames and motion. With a slight motion of our camera—even at subpixel levels—we can reverse engineer subpixel information and improve it. With computational imaging, we can also create a mosaic combining three types of images, the longwave infrared, a shortwave infrared, which is more like night vision, and then normal, daylight optical images which help us further pinpoint the type of leaks in structures. The initial system is a proof-of-concept device. Our goal is to deploy a beta prototype capable of much higher throughput and to construct many more imaging systems with additional types of sensors. This will capture data at greater heights from different angles and allow us to see more detail on the front and sides of a building.
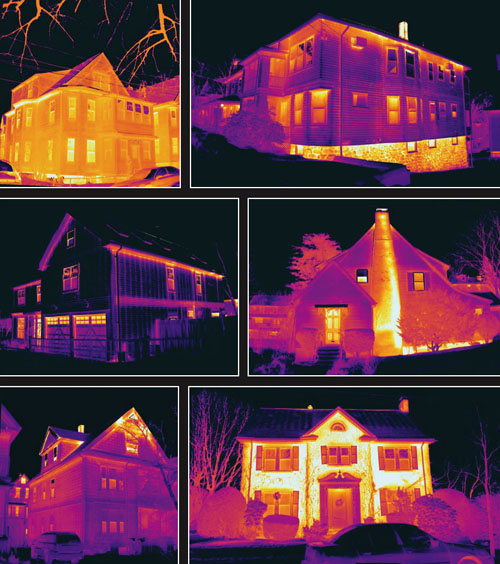
A. S. What do the Cambridge images reveal?
J. J. and L. P. In the winter, when temperatures outside are much lower than those inside, several types of heat transfer processes become obvious in buildings. The problems originate with windows, doors, sills, joists, basement walls, insulation and other types of thermal envelope issues that bleed energy out of a structure. A majority of these problems tend to be caused by small air leaks concentrated on specific locations on the envelope of a building. The leaks are easy to fix but they can be hard to find without sufficient camera resolution. We found varying degrees of energy loss across buildings of all ages. Some buildings had good insulation on some levels and very poor insulation on others. Some windows were good while adjacent windows were bad. No two structures were exactly the same.
A. S. How do you execute the mapping?
J. J. and L. P. The magnitude of the amount of imaging and other data—including structural information for each building over the six square miles in Cambridge—is on the order of multiple terabytes. These data were transferred, geo-tagged and mapped onto a geographic information system map. Finally, algorithms were written to interpret the data, quantify the size and type of energy leaks and create an energy report for each address on the map. The result is a first-of-its-kind negawatt map that shows detailed macro-to-micro information on a city’s total energy leakage.
In Sightings, American Scientist publishes examples of innovative scientific imaging from diverse research fields.
American Scientist Comments and Discussion
To discuss our articles or comment on them, please share them and tag American Scientist on social media platforms. Here are links to our profiles on Twitter, Facebook, and LinkedIn.
If we re-share your post, we will moderate comments/discussion following our comments policy.