Life Cycles
By Brian Hayes
Are there periodic booms and busts in the diversity of life on Earth? Hear a tale of fossils and Fourier transforms
Are there periodic booms and busts in the diversity of life on Earth? Hear a tale of fossils and Fourier transforms

DOI: 10.1511/2005.54.299
Life has its ups and downs. Half a billion years ago, the sudden proliferation of hard-bodied creatures in the Cambrian period was an uptick; the mass extinction that wiped out the last of the dinosaurs at the end of the Cretaceous was a major downer.
Several students of the history of life have suggested that these peaks and valleys have a regularity to them—that they are not just random fluctuations but periodic oscillations, possibly synchronized to some external pacemaker. In the 1970s Keith Stewart Thomson, then of Yale University (and now a columnist for this magazine), noted surges in the diversity of various animal groups at intervals of 62 million years. Then Alfred G. Fischer and Michael A. Arthur of Princeton University suggested that extinctions come in waves every 32 million years. Later, David M. Raup and J. John Sepkoski, Jr., of the University of Chicago offered a revised mass-extinction timetable with a period of 26 million years. Now there's yet another sighting of cyclic tides in biodiversity, this time with super-imposed wavelengths of 62 million years (again!) and 140 million years. The new report comes from Richard A. Muller, a physicist at Lawrence Berkeley National Laboratory, and Robert A. Rohde, a graduate student in physics at the University of California, Berkeley. Their analysis was published in Nature this past March.
Brian Hayes
To a naive observer, the sheer variety of these proposals invites a certain skepticism. If there's a loud and steady drumbeat in the history of life, shouldn't everyone hear the same rhythm? On the other hand, if the signal is faint and has to be teased out of a noisy background, could we be perceiving patterns in what is really random noise? Just how do you go about detecting such an oscillation, and how do you know whether or not it's real?
A reading of the various claims and counterclaims on periodicity in the fossil record did not answer these questions for me. I felt an urge to explore the data for myself, to see just how much teasing it needs. Some years ago, such an undertaking would have been unthinkable for anyone but insiders and experts—and I am neither. But computational science is a great equalizer. The tools and data are now widely available. The mathematics required is not too daunting. Muller and Rohde have posted a detailed and very helpful technical supplement—almost a how-to manual—on the Nature Web site. If you're willing to write a few programs, you too can create mass extinctions on your home computer.
Of course access to tools and data does not guarantee the skill to use them well—as I shall demonstrate forthwith.
The search for patterns in the history of life builds on the labor of generations of paleontologists who went out in the field to dig up fossils. It also owes a debt to one paleontologist who went into the library to dig up thousands of records of fossil discoveries. John Sepkoski began this research while he was still a student of Stephen Jay Gould in the 1970s; by the time of Sepkoski's death in 1999 (at age 50), his database had grown to include more than 36,000 genera of marine organisms. The compendium was published in 2002, both as a weighty tome and as a CD-ROM.
The Sepkoski database has a simple structure. For each genus, he lists the oldest and the youngest geological layers in which at least one member of the genus is reported to appear. For example, the genus Tellinimera carries the notation "K (Camp-l) - T (Dani), signifying that these bivalve molluscs are first observed in the lower substage of the Campanian stage of the Cretaceous period (which is abbreviated K to avoid confusion with the Cambrian and the Carboniferous); the last appearances are in the Danian stage of the Tertiary period. (Thus Tellinimera was one of the lucky survivors of the K-T catastrophe, the extinction that's famous for doing in the dinosaurs.)
Even though the Sepkoski compendium is available on CD-ROM, getting it into a form suitable for further analysis is more than a routine clerical chore. I did some preliminary reformatting with the search-and-replace functions of a text editor, then wrote a small program to do further processing, and finally imported the result into a database manager. What's maddening about such a conversion process is that even tiny typographical inconsistencies in the text—a misplaced hyphen, an extra tab character—can totally derail the operation. Other kinds of errors turn up, too. For example, I found a few dozen entries where Sepkoski apparently recorded the same genus twice. Such minor oversights are hardly a surprise in a document that took decades to compile, and which the author never had a chance to review and revise before publication. In any case, for statistical purposes the database needn't be perfect; random errors might blur a genuine periodic signal, but they are unlikely to generate a spurious one.
The database gives the dates of fossils in terms of geologic periods, epochs, stages and so on; for studies of periodicity, these layers of the stratigraphic column have to be assigned dates and durations in calendar years. As it happens, a new calibration of the geologic sequence, assembled by the International Commission on Stratigraphy, has just been published (in a tome even weightier than the Sepkoski compendium). Based on radio-isotope measurements, paleomagnetism and evidence of astronomical cycles, Geologic Time Scale 2004, or GTS2004, gives dates for strata as far back as the beginning of the Cambrian period—which according to GTS2004 was 542 million years ago.
The Sepkoski compendium mentions almost 300 geologic intervals, to which Muller and Rohde assigned numerical dates based on the new time scale. The task was not entirely straightforward because of changes and variations in nomenclature. For example, Sepkoski refers to a Wolf-campian epoch, which is not recognized in GTS2004; Muller and Rohde defined it as the union of two stages.
Even after dates have been assigned to the stratigraphic layers, the lifespans of the fossil organisms are still not quite pinned down. Consider again the genus Tellinimera. Under the GTS2004 calibration, its first appearance in the lower Campanian could have been at any time between 83.5 and 77.05 million years ago (mya), and its last gasp in the Danian was somewhere between 65.5 and 60.2 mya. Depending on how the dates of origination and extinction are chosen within those intervals, Tellinimera could have lasted for anywhere from 11 to 23 million years.
For genera whose dates are known with the greatest precision—to the substage level of detail—Muller and Rohde adopt a simple convention: If a genus first appears within a substage, they set its date of origination to the beginning of that substage. By this rule Tellinimera is assumed to arise at 83.5 mya. Likewise a last appearance within a substage is assigned to the end of that substage. Where the data specify only a stage rather than a substage, Muller and Rohde follow a more complicated policy, allocating fractions of a genus to each possible subdivision. Thus the extinction of Tellinimera is shared equally between the two substages of the Danian stage; half of the genus dies out at the end of the lower Danian (62.85 mya) and half at the end of the upper Danian (60.2 mya). For genera dated only at the epoch or period level, an even more elaborate algorithm comes into play.
The net effect of this procedure is to divide geologic time into a series of nonoverlapping units, with an average duration of roughly three million years. Although the fractional allocations spread some events over several of these units, it is still the case that all originations and extinctions occur at the boundaries between units. Nothing ever happens during a substage.
The decision to locate all changes at stratum boundaries has a plausible argument in its favor. The boundaries were defined in the first place because they mark distinctive shifts in fossil biota, and so originations and extinctions ought to be clustered there. Still, it can't be true that all taxa began and ended their existence at those selected transition moments. So I decided to try distributing the events more evenly, a decision made in the spirit of idle experimentation, to see whether it would have any effect on the outcome.
For each genus I assigned a date of origination by selecting a moment at random from within the whole interval in which the earliest fossil was reported. For Tellinimera all dates in the lower Campanian, between 83.5 and 77.05 mya, would be equally likely. Extinction dates are chosen in the same way, by picking a number at random within the interval of last appearance. (Special care is needed when a genus begins and ends in the same time unit: It must not die before it is born.)
Under this plan, the average longevity of a genus is halfway between the minimum and the maximum possible. Moreover, the scheme has the attractive property that greater uncertainty in the dating of a fossil automatically translates into greater variance in the randomly assigned dates. If all we know about a genus is that it arose sometime in the Permian, then the randomizing procedure can assign it any date in the 48-million-year span of that period.
The major drawback of a randomized date assignment is that it makes the analysis nondeterministic. Every run of the program gives a slightly different result. But the law of large numbers protects us. Although any particular genus may be assigned quite different dates in successive runs, the outcome averaged over all 36,000 genera is highly predictable.
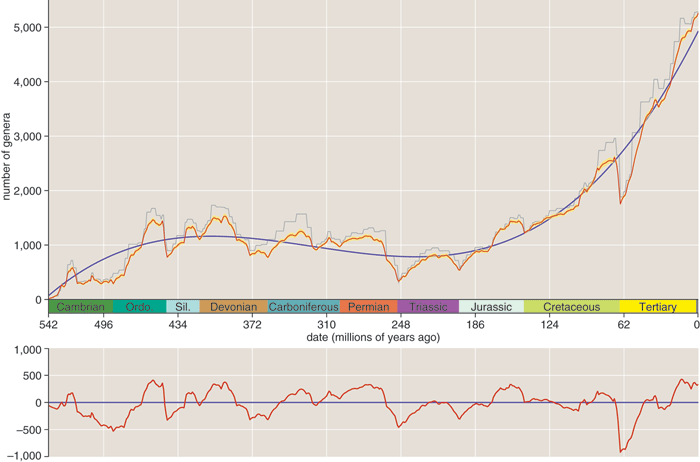
The final step in converting Sepkoski's database into a chronicle of biological diversity is to construct a histogram giving the number of extant genera as a function of time. My histograms have bins 1 million years wide, so 542 bins span the interval since the start of the Cambrian. Once the bins are set up, a program scans through the list of genera, placing each of the 36,000 origination and extinction events in its proper bin. Then a pass through the bins from earliest to latest increments the number of extant genera for each origination and decrements it for each extinction. The result is the graph at the top of this column.
Does that wiggly line reveal a periodic oscillation? There are certainly plenty of humps and dips, including deep valleys that correspond to several mass extinctions. But are the ups and downs periodic, with a fixed time scale? Or do they look more like the meandering of a random walk? The eye is not a reliable judge in such matters, sometimes inventing regularities that don't exist and missing others that do.
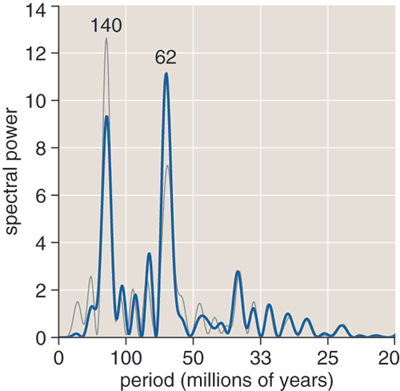
A better tool for teasing out periodicity is Fourier analysis, Joseph Fourier's mathematical trick for taking apart a curve with arbitrarily intricate wiggles and reassembling it out of simple sine waves. The Fourier transform identifies a set of component waves that add up to a replica of any given signal. The result can be presented as a power spectrum, which shows the amount of energy in the signal at each frequency.
Fourier analysis is often treated as a black box. Put in any time-domain signal, turn the crank, and out comes the frequency-domain equivalent, with no need to worry about how the process works. Muller has argued against this kind of mystification; he is co-author (with Gordon J. MacDonald) of an excellent book on spectral analysis that opens the lid of the box. Among other things, Muller and MacDonald present a complete program for Fourier analysis in seven lines of basic.
The black-box approach to Fourier transforms is not only unnecessary but also misleading. It's simply not true that you can run any data through a Fourier analysis and expect a meaningful result. On the contrary, rather careful preprocessing is needed.
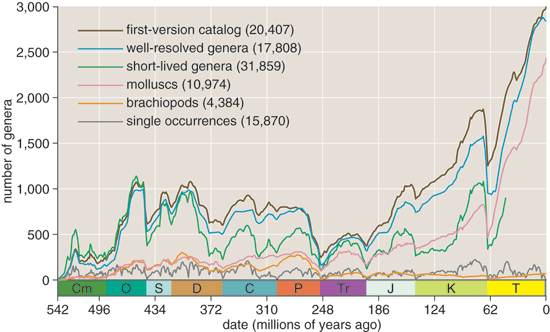
Here are the preliminaries Muller and Rohde went through with the fossil-diversity data. First they selected only the "well-resolved genera, those dated to the stage or substage level; they also excluded all genera known only from a single stratum. This refinement process discards fully half of the data set. Next, they calculated the cubic polynomial that best fits the data and subtracted this "detrending curve from the data. The residual values left by the subtraction form a new curve in which the largest-scale (or lowest-frequency) kinks have been straightened out. This is the curve they finally submitted to Fourier analysis.
Brian Hayes
Muller and Rohde's result—or rather my reconstruction of something like it—appears above. The spectrum has a tall spike at a period of 62 million years and a lesser peak at 140 million years, indicating that these two periods account for most of the energy in the signal.
When I first read about the practice of selecting and detrending the data, it seemed highly manipulative: First you throw away half the data, then you suppress the most conspicuous features in what remains. The choice of a cubic polynomial for the detrending curve was particularly troubling. Why a cubic, rather than, say, a linear or an exponential trend line? The obvious answer is that the cubic curve fits the data very well, and other curves don't, but that seemed rather ad hoc. If you're allowed to invent any detrending curve you please, then you can generate any result you want.
Muller and Rohde have persuaded me that these concerns were unfounded. The exclusion of genera with uncertain dates was not a way of enhancing the signal—which in fact is just as clear in the complete data set as it is in the well-resolved subset—but rather addressed concerns that poor-quality data might be seen as contaminating their result. And the detrending method has long been standard procedure in Fourier analysis. The polynomial curve is not meant to represent any meaningful trend in the data; it is simply a device for filtering out the lowest-frequency components of the signal, which would otherwise dominate the spectrum and obscure everything else. The long-period trends in diversity—especially the dramatic rise since the Cretaceous—may well be the most intriguing aspects of the fossil record, but they are not the subject of study here. The Fourier analysis is confined to a specific band of frequencies, corresponding to periods of roughly 200 down to 20 million years. The detrending process imposes the long-period limit, and a short-period cutoff comes from the finite resolution of the geologic time scale. Only features within this band are to be examined.
Brian Hayes
It is the nature of the Fourier transform to highlight the strongest periodicities in any signal, whatever they might be. Because some peaks are bound to emerge even in a spectrum made from random data, a crucial question is whether the 62- and 140-million-year peaks climb far enough above the background level to be considered statistically significant. Muller and Rohde address this issue through Monte Carlo simulation, generating thousands of random histograms and running them through their Fourier-analysis mill. In essence they ask: If we had 10,000 planets like the Earth and we could dig up fossils on all of them, how often would we see spectral features as strong as those observed in the real fossil record? They conclude that a peak as tall and narrow as the 62-million-year signal would turn up randomly no more than 1 percent of the time; the case for the 140-million-year peak is less compelling. I have not attempted to reproduce the Monte Carlo analysis, although it is clearly key to evaluating claims of periodicity.
For my own first experiments with the analysis of the diversity curve, I decided to retain the entire set of 36,000 genera rather than discard the doubtful cases; this proved not to be a problem. But my attempts to get along without the cubic detrending curve were unsuccessful. Fitting the data to linear or exponential curves left large residuals, producing a massive low-frequency lump in the spectrum that swamped all other signals. I tried piecing together two linear trends, with a hinge point where the slope changes in the Cretaceous, but that didn't help much. I had to concede the point: If you want to examine midrange frequencies in this data set, you need to remove lower frequencies first. A cubic curve seems to be the best way to do that.
When I finally got a result, it was not what I expected. I would not have been surprised to see a spectrum identical to that of Muller and Rohde; after all, I was working from the same data and following similar procedures. I would not have been astonished to see something totally nonsensical, stemming from a bug in my program. But in fact my graph was very similar to theirs, with peaks in the same positions, yet there was also a conspicuous difference: The spikes at 62 and 140 million years had swapped amplitudes. The 140-million-year peak was the higher one, looming over its shorter-period sibling.
Tracking down the source of this discrepancy took more than a week. My suspicion focused first on the decision to include all the genera, even those of doubtful provenance. But when I reran the analysis with only well-resolved genera, the outcome was very similar, with energy still concentrated in the 140-million-year peak.
Brian Hayes
Next I considered the main visual difference between the histograms that I generated and those published by Muller and Rohde. Randomizing the dates of origination and extinction yields a smoother contour, without the stairstep profile created when all changes come at substage boundaries. Maybe the sharp corners of the stairsteps somehow shift energy into the higher-frequency band? Again the facts proved me wrong. I applied a smoothing filter to rub the corners off the Muller-Rohde curve, and another algorithm to add sharper local transitions to my own histogram. The spectra were unchanged, continuing to disagree about the relative heights of the peaks.
In the course of my struggles with this issue, I tried altering my methods in a number of ways, and eventually wound up with a diversity curve that appeared to match the Muller-Rohde curve in all but a few local details—and yet still the two spectra disagreed. Could such tiny disparities have large consequences? The puzzle was solved by Rohde, who guessed the source of the trouble as soon as I sent him a copy of my graphs. Sepkoski had cataloged a handful of genera from the Vendian period, which preceded the Cambrian. Because the Vendian record was sparse and fragmentary, Muller and Rohde had excluded it from their analysis. I knew of this decision, but I had neglected to snip away the long tail of Upper Vendian stragglers from my version of the database. (They were included in the Fourier analysis, but were invisible in the graphs I had been drawing.) Rohde correctly deduced that the presence of those extra data points, spread out over an interval of 23 million years, would cause just the distortion I was seeing, reinforcing the 140-million-year wave and damping the 62-million-year one. Once I truncated my histograms at the start of the Cambrian, the spectra produced by my program matched the ones published by Muller and Rohde.
The question that launched me on this adventure was whether evidence of periodicity is something blatant and robust and unmistakable, or whether the procedures needed to detect it are subtle, temperamental and subjective. My answers remain murky.
On the one hand, it was a relief to find that no careful selection or heavy-handed mistreatment of the data were needed to bring forth the two signals reported by Muller and Rohde. The peaks emerged clearly from the entire data set or from many different subsets, and the positions of the peaks along the frequency axis were quite stable, unaffected by variations in analytic method. Even the extraneous Vendian data altered only the heights of the peaks, not their positions at 62 and 140 million years.
But my troubles with the heights of the peaks were chastening. In the end the cause turned out to be a simple error; but, then again, I knew that something was amiss only because I had the right answer given to me. Under other circumstances, the decision to keep or to discard the Vendian genera might be an open question. The choice made about this seemingly minor component of the data—it amounts to 0.2 percent—can have a visually conspicuous effect on the outcome. (Whether the effect is also statistically significant is a question I have not addressed.)
Mathematically, the Fourier transform is well-defined and deterministic, with no more room for subjectivity than, say, the conversion of rectangular to polar coordinates. The same input always yields the same output. In practice, though, there are knobs and dials to twiddle—choices to be made in preparing the input and presenting the output. As with many other methods, it's these niggling details—how to deal with outliers, how to correct for systematic biases—that cause most of the trouble.
Perhaps it is foolish for an untrained amateur even to attempt using such tools; certainly the tools are not to be blamed just because a neophyte fails to get the right answer on the first try. But still I cherish the notion that ordinary readers can assess a scientific claim for themselves, by analyzing the evidence and working through the steps of the argument, not by appeals to authority or consensus.
Apart from my methodological muddles, what should we make of the oscillations in fossil diversity? A tall, sharp peak in a Fourier spectrum implies that the underlying wave has a very steady frequency and phase. Such long-term regularity is unusual in biological systems, and so Muller and Rohde argue that there must be some external driving force. Muller favors an astronomical explanation, perhaps something related to the motion of the solar system through the galaxy. Rohde is more partial to geological causes, such as recurrent episodes of volcanism caused by periodic events in the Earth's mantle.
Muller and Rohde have looked for correlations between the cycles in fossil diversity and various geophysical phenomena, such as indicators of past climate and sea level. They note a 135-million-year-cycle in glaciation, statistically indistinguishable from the wavelength of their 140-million-year cycle. There are several other possible matches as well, but none of them is compelling enough for Muller and Rohde to endorse one candidate cause among all the contenders.
© Brian Hayes
Click "American Scientist" to access home page
American Scientist Comments and Discussion
To discuss our articles or comment on them, please share them and tag American Scientist on social media platforms. Here are links to our profiles on Twitter, Facebook, and LinkedIn.
If we re-share your post, we will moderate comments/discussion following our comments policy.