Graph Theory in Practice: Part I
By Brian Hayes
Graphing netlike objects—including the World Wide Web
Graphing netlike objects—including the World Wide Web

DOI: 10.1511/2000.15.9
What is the diameter of the World Wide Web? The answer is not 7,927 miles, even though the Web truly is World Wide. According to Albert-László Barabási, Reka Albert and Hawoong Jeong of Notre Dame University, the diameter of the Web is 19.
The diameter in question is not a geometric distance; the concept comes from the branch of mathematics called graph theory. On the Web, you get from place to place by clicking on hypertext links, and so it makes sense to define distance by counting your steps through such links. The question is: If you select two Web pages at random, how many links will separate them, on average? Among the 800 million pages on the Web, there's room to wander down some very long paths, but Barabási et al. find that if you know where you're going, you can get just about anywhere in 19 clicks of the mouse.
Barabási's calculation reflects an interesting shift in the style and the technology of graph theory. Just a few years ago it would have been unusual to apply graph-theoretical methods to such an enormous structure as the World Wide Web. Of course just a few years ago the Web didn't exist. Now, very large netlike objects seem to be everywhere, and many of them invite graph-theoretical analysis. Perhaps it is time to speak not only of graph theory but also of graph practice, or even graph engineering.
The graphs studied by graph theorists have nothing to do with the wiggly-line charts that plot stock prices. Here is a definition of a graph, in all its glory of abstraction: A graph is a pair of sets, V and E, where every element of E is a two-member set whose members are elements of V. For example, this is a graph: V = {a, b, c}, E = {{a, b}, {a, c}}.
So much for definitions; most of us prefer to think of our graphs graphically. And in fact everyone knows that what graph theory is really about is connecting the dots. The set V is made up of vertices (also known as nodes), which are drawn as dots. The set E consists of edges (also called arcs, links or bonds), and each edge is drawn as a line joining the two vertices at its end points. Thus the graph defined abstractly above looks like this:
Most of the time, a picture is worth at least a thousand sets, and yet there are reasons for retaining the more formal definition. When you look at a graph drawing, it's hard not to focus on the arrangement of the dots and lines, but in graph theory all that matters is the pattern of connections: the topology, not the geometry. These three diagrams all depict the same graph:
Each of the graphs sketched above is in one piece, but not all the vertices in a graph have to be joined by edges; disconnected components can be parts of a single graph. "Multigraphs" are allowed to have multiple edges connecting the same pair of vertices. And some graphs have self-loops: edges whose two ends are both attached to the same vertex. Another variation is the directed graph, where each edge can be traversed in only one direction.
Graph theory got its start in the 18th century, when the great Swiss-born mathematician Leonhard Euler solved the puzzle of the Königsberg bridges. At the time, Königsberg (now Kaliningrad) had seven bridges spanning branches of the Pregel River. The puzzle asked whether a walk through the city could cross each bridge exactly once. The problem can be encoded in a graph (actually a multigraph) by representing the land areas as vertices and the bridges as edges:
Euler showed that you can answer the question by tabulating the degree, or valency, of each vertex—the number of edges meeting there. If a graph has no more than two odd vertices, then some path traverses each edge once. In the Königsberg graph all four vertices are odd.
The techniques of graph theory soon proved useful for more than planning a stroll along the Pregel. The German physicist Gustav Kirchoff analyzed electric circuits in terms of graphs, with wires as edges and junction points as vertices. Chemists found a natural correspondence between graphs and the structural diagrams of molecules: An atom is a vertex, and an edge is a bond between atoms. Graphs also describe communications and transportation networks, and even the neural networks of the brain. Other applications are less obvious. For example, a chess tournament is a graph: The players are nodes, and matches are edges. An economy is also a graph: Companies or industries are nodes, and edges represent transactions.
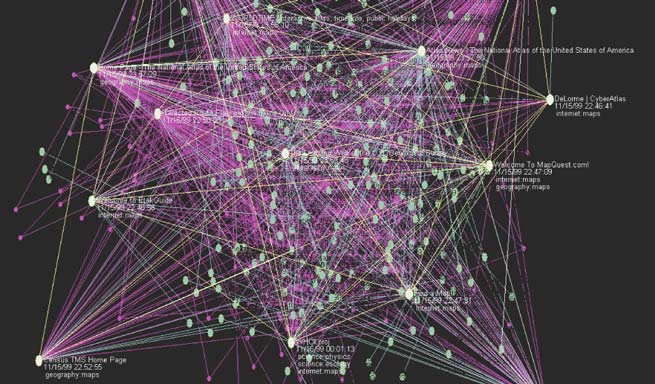
Image courtesy of Kiva Korsak.
In the 20th century graph theory has become more statistical and algorithmic. One rich source of ideas has been the study of random graphs, which are typically formed by starting with isolated vertices and adding edges one at a time. The master of this field was the late Paul Erdos. With his colleague Alfred Rényi, Erdos made the central finding that a "giant component"—a connected piece of the graph spanning most of the vertices—emerges suddenly when the number of edges exceeds half the number of vertices.
The recent work on the World Wide Web and other very large graphs is also statistical and algorithmic in nature, and it has close ties to the Erdos-Rényi theory of random graphs. But there is a new twist. Many of these huge graphs are not deliberate constructions but natural artifacts that have grown through some accretionary or evolutionary process. The Web, in particular, is an object no one designed. On close examination, the structure of such graphs seems neither entirely random nor entirely regular. Understanding the balance of order and chaos in these graphs is one of the aims of the current undertakings. A more basic goal is simply finding computational techniques that will not choke on a graph with 108 nodes.
A good example of a really big graph comes from telephone billing records. Joan Feigenbaum of the AT&T Shannon Laboratories in Floral Park, New Jersey, heads a group working with a graph known as the call graph. The vertices are telephone numbers, and the edges are calls made from one number to another. A specific call graph recently analyzed by James M. Abello, P. M. Pardalos and M. G. C. Resende of AT&T has 53,767,087 vertices and more than 170 million edges.
The call graph is actually a directed multigraph—directed because the two ends of a call can be distinguished as originator and receiver, a multigraph because a pair of telephones can exchange more than one call in a day. For ease of analysis, these aspects of the graph are sometimes ignored: Sets of multiple edges are collapsed into a single edge, and the graph is treated as if it were undirected. (The graph also has some 255 self-loops, which I find rather puzzling. I seldom call myself, and it's never long-distance.)
The first challenge in studying the call graph is that you can't swallow it whole. Even though the analysis was done on a computer with six gigabytes of main memory, the full graph would not fit. Under these conditions most algorithms are ruinously inefficient, because pieces of the graph have to be repeatedly shuttled between memory and disk storage. The call graph has therefore become a test-bed for algorithms designed to run quickly on data held in external storage.
What did Abello, Pardalos and Resende learn about the call graph? It is not a connected graph but has 3.7 million separate components, most of them tiny; three-fourths of the components are pairs of telephones that called only each other. Yet the call graph also has one giant connected component, with 44,989,297 vertices, or more than 80 percent of the total. The emergence of a giant component is characteristic of Erdos-Rényi random graphs, but the pattern of connections in the call graph is surely not random. Some models that might describe it will be taken up in Part II of this article, to appear in the March–April issue.
Abello and his colleagues went hunting within the call graph for structures called cliques, or complete graphs. They are graphs in which every vertex is joined by an edge to every other vertex. Identifying the largest such structure—the maxclique—is computationally difficult even in a graph of moderate size. In the call graph, the only feasible strategy is a probabilistic search that finds large cliques without proving them maximal. Abello et al. found cliques of size 30, which are almost surely the largest. Remarkably, there are more than 14,000 of these 30-member cliques. Each clique represents a distinct group of 30 individuals in which everyone talked with everyone else at least once in the course of a day.
Some of the most interesting large graphs are those in which we are the vertices. These "social graphs" are associated with the phrase "six degrees of separation," popularized by a 1990 play of that title and a later film, both written by John Guare. The idea is that the acquaintanceship graph connecting the entire human population has a diameter of six or less. Guare attributes this notion to Guglielmo Marconi, who supposedly said that wireless telegraphy would so contract the world that any two people could be connected by a chain of 5.83 intermediaries. Did Marconi really make such a statement? I have been unable to find any evidence. (And the two decimal places of precision do nothing to increase my faith in the number's authenticity).
Even if Marconi did have ideas about the acquaintanceship graph, they were unknown to those who later took up the subject. In the 1950s and 60s Anatol Rapoport based a theory of social networks on the idea of random graphs. He showed that any bias in the random placement of edges tends to reduce the overall connectivity of the graph and increases its diameter. Thus social structures that bring people together in clusters have the side effect of pushing the clusters farther apart. On the basis of this mathematical result, the sociologist M. S. Granovetter argued that what holds a society together are not the strong ties within clusters but the weak ones between people who span two or more communities.
Also in the 1950s, Ithiel de Sola Pool and Manfred Kochen tried to estimate the average degree of the vertices in the acquaintanceship graph and guessed that the order of magnitude is 1,000. This high density of interpersonal contacts led them to conjecture that anyone in the U.S. "can presumably be linked to another person chosen at random by two or three intermediaries on the average, and almost with certainty by four."
Brian Hayes
This "small-world hypothesis" was put to the test a decade later in a famous experiment by Stanley Milgram. Packets addressed to an individual in the Boston area were given to volunteers in Nebraska and Kansas. Each volunteer was directed to pass the packet along to any personal acquaintance who might get it closer to its intended recipient. Instructions within the packet asked each person who received it to follow the same procedure. For the packets that made it all the way to their destination, the mean number of intermediary nodes was 5.5.
Milgram's experiment was ingenious, and yet it did not quite establish that everyone on the planet is within six handshakes of everyone else. In the first place, the reported path length of 5.5 nodes was an average, not a maximum. (The range was from 3 to 10.) Two-thirds of the packets were never delivered at all. Furthermore, although Nebraska and Kansas may seem like the ends of the earth from Massachusetts, the global acquaintanceship graph probably has a few backwaters even more remote. And if Milgram's result is not an upper bound on the diameter of the graph, neither is it a lower one: There is no reason to believe that all the participants in the study found the shortest possible route.
Certain subgraphs of the acquaintanceship graph have been explored more thoroughly. The prototype is the "collaboration graph" centered on Paul Erdos, who was the most prolific mathematician ever (Euler was second). In this graph distance from Erdos's node is termed the Erdos number. Erdos himself has an Erdos number of 0. All those who co-authored a paper with him have Erdos number 1. Those who did not write a joint paper with Erdos but who are co-authors of a co-author have Erdos number 2, and so on. The graph built up in this way, by adding concentric layers of co-authors, can be viewed as a component of a larger graph with a node for every contributor to the literature of science. Although the graph as a whole cannot be connected—if only because of "soloists" who never collaborate with anyone—the connected component centered on Erdos is thought to encompass almost all active scientists and to have a small diameter.
Another collaboration graph has movie actors instead of scientists at the vertices, with the central role given to Kevin Bacon. Because feature films are a smaller universe than scientific publications, the structure of this "Hollywood graph" can been determined in greater detail. If the records of the Internet Movie Database can be taken as complete and definitive, then the Hollywood graph has 355,848 vertices, representing actors who have appeared in 170,479 films.
Brett C. Tjaden and Glenn Wasson of the University of Virginia maintain a Web site (The Oracle of Bacon) that tabulates Bacon numbers. Because the entire graph is known, there is no need to speculate about whether or not it is connected or what its diameter might be. The questions can be answered directly. The Hollywood graph includes exactly one person with Bacon number 0 (that one's easy to guess); there are 1,433 with Bacon number 1; another 96,828 have Bacon number 2, and 208,692 occupy nodes at Bacon number 3. But because the number of actors is finite, the rings around Bacon cannot continue expanding. At Bacon number 4 there are 46,019 actors, then 2,556 at distance 5, and 252 at Bacon number 6. Finally there are just 65 actors who require seven intermediaries to be connected to Kevin Bacon, and two exceptionally obscure individuals whose Bacon number is 8. (Finding any actor in tiers 7 or 8 will earn you a place in the Oracle's hall of fame.)
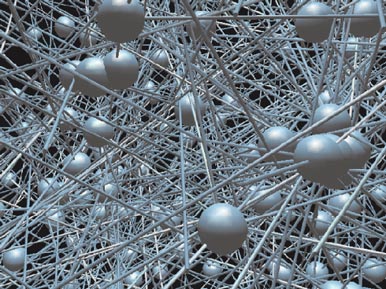
Image was created with View_Net, written by Klovdahl and R. H. Payne.
A new attempt to construct a major piece of the global acquaintanceship graph is now under way at a Web site called sixdegrees.com, founded by Andrew Weinreich. Here you are invited to fill out a form listing the e-mail addresses of your friends, who will be invited to create database entries of their own. Thus, you should be able to explore the social graph as seen from your own position in it—everyone gets a chance to be Kevin Bacon or Paul Erdos. When I last checked, sixdegrees.com had 2,846,129 members. Statistics on the structure of the evolving graph have not been published, but a review by Janelle Brown in Salon magazine offers some clues. Brown reports: "I, for example, have fourteen contacts in my inner circle, 169 in my second degree, 825 in my third, 3,279 in my fourth, 10,367 in my fifth and 26,075 in my sixth." The fact that these numbers continue increasing and have not begun to approach the total size of the graph suggests that a giant connected component has not yet emerged at sixdegrees.com.
As an object of study for graph theorists, the World Wide Web has the advantage that it comes already encoded for computer analysis. The vertices and edges do not have to be catalogued; any computer attached to the Internet can navigate through the graph just by following links from node to node. Like the AT&T call graph, the Web is a directed multigraph with self-loops, but many analyses ignore these complications and treat the Web as if it were a simple undirected graph.
To estimate the diameter of the Web, Barabási and his colleagues at Notre Dame did not visit every node and traverse every link; they studied a small corner of the Web and extrapolated to the rest of the graph. The Barabási group used a software "robot" to follow all the links on a starting page, then all the links on each page reached from that page, and so on. This is the same technique employed by search engines to index the Web, but search engines are never exhaustive; they are tuned to catalogue documents of interest to people, not to measure the connectivity of a graph.
Initially, the Notre Dame robot looked only at the nd.edu Internet domain and gathered information on 325,729 documents and 1,469,680 links (about 0.3 percent of the Web). The key step in the analysis of these data was to calculate the probability that a page has a given number of inward and outward links. Barabási and his colleagues found that both probabilities obey a power law. Specifically, the probability that a page has k outward links is proportional to k–2.45, and the probability of k inward links is given by k–2.1. The power law implies that pages with just a few links are the most numerous, but the probability of larger numbers of links falls off gradually enough that pages with several hundred or several thousand links are to be expected.
Although nodes of very high degree are rare, they have an important effect on the connectivity of the Web. Such nodes shrink the graph by providing shortcuts between otherwise distant vertices. For the nd.edu domain, Barabási et al. measured an average diameter of 11.2 edges; the power-law model predicted 11.6. Extrapolating to the Web as a whole yielded a diameter of about 19 links.
The diameter of the graph is an important statistic when you are trying to find something on the Web. A blind, random search would typically have to examine half the 800 million documents before stumbling on the right one. But the Notre Dame result suggests that from any reasonable starting point, there should be a path to the target page crossing only about 19 links. Barabási et al. remark: "The relatively small value of [the diameter] indicates that an intelligent agent, who can interpret the links and follow only the relevant one, can find the desired information quickly by navigating the web." (But finding the relevant link is not always easy! When I tried searching for paths between randomly chosen pages, I came away doubting that I qualify as an intelligent agent.)
Rare nodes of high degree also play a role in other graph-theoretical analyses of the Web. One group doing such work calls itself the Clever project. The vertices in the Clever collaboration graph include Jon Kleinberg of Cornell University and Prabhakar Raghavan and Sridhar Rajagopalan of the IBM Almaden Research Center. The Clever group draws attention to two special kinds of nodes in the Web. "Hubs" are nodes of high out-degree—pages that point to many other pages. "Authorities" have high in-degree—they are pointed to by many other pages, and especially by hubs. Typical hubs are lists of personal bookmarks or pages from directory services such as Yahoo. An authority is a Web page that many people find interesting enough to create a link to it.
The Clever algorithm defines hubs and authorities by an iterative feedback process. An initial scan of the Web identifies pages of high out-degree and high in-degree, which form the initial sets of candidate hubs and authorities. Then these sets are refined by a recursive procedure that discards a hub candidate unless many of its outward links point to pages that are members of the authority set; likewise authorities are weeded out unless they are pointed to by many of the hubs. Repeated application of this algorithm narrows the focus to those hubs and authorities that are most densely connected to one another.
In one project, members of the Clever group have employed links between hubs and authorities to identify more than 100,000 "emerging communities"—collections of Web sites that share some common theme. For example, the survey found pages associated with Australian fire brigades and with Turkish student organizations in the U.S. Remarkably, the communities were identified by a method that did not rely in any way on the content of the Web pages; the algorithm looked only at the pattern of connectivity.
Similar principles are at work in a Web search engine called Google, developed by Sergey Brin and Lawrence Page of Stanford University. Google employs a conventional text-based scan to create an index of the Web's content, but the pages recommended in response to a query are ranked according to information from the link analysis. A page is rated highly if many pages point to it, and if many other pages point to those pages, and so on.
Measuring properties of a graph such as the diameter or the distribution of vertex degrees is a first step toward understanding its structure. The next step is to develop a mathematical model of the structure, which typically takes the form of an algorithm for generating graphs with the same statistical properties. Such models of very large graphs will be the subject of Part II of this article.
© Brian Hayes
Click "American Scientist" to access home page
American Scientist Comments and Discussion
To discuss our articles or comment on them, please share them and tag American Scientist on social media platforms. Here are links to our profiles on Twitter, Facebook, and LinkedIn.
If we re-share your post, we will moderate comments/discussion following our comments policy.