Water, Migration and the Serengeti Ecosystem
By Eric Wolanski, Emmanuel Gereta, Markus Borner, Simon Mduma
Understanding the mechanisms that control the timing of wildlife migrations may prove vital to successful management
Understanding the mechanisms that control the timing of wildlife migrations may prove vital to successful management

DOI: 10.1511/1999.42.526
A big weather wind from the southeast came up in the late morning, and by noon it was shifting to the east, turning the dark clouds on the Crater Highlands. Once again, the herds were moving.
—Peter Matthiessen, The Tree Where Man Was Born
Each year, some time near the end of the wet season in Serengeti National Park, Tanzania, one of nature's most spectacular phenomena begins. Approximately 1 million wildebeests (Connochaetes taurinus) and a smaller number of zebras set off on a journey that will lead them from their wet-season range in the south of the park to the northwestern dry-season range, then to the southwest and finally back to the south. Over the course of the year, the animals travel an average of 10 kilometers per day.
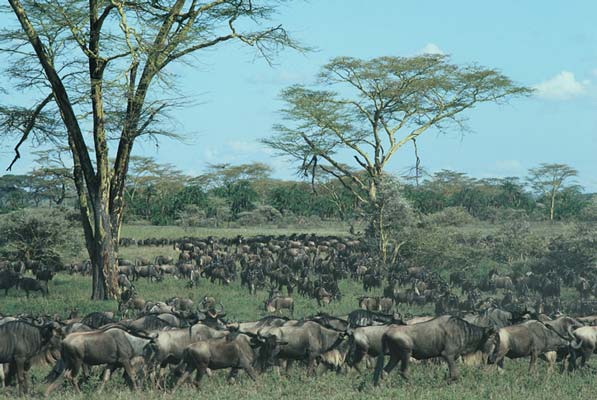
Sven-Olaf Lindblad (Photo Researchers, Inc.)
Not only does the migration extract a large cost in energy, but calving also coincides with the arrival of the wildebeests in the southern range, and many of the newborn fail to survive the trek to the northwest. Indeed, it has been estimated that the migration increases wildebeest mortality by 3 percent per year compared with populations that remain in the northwest. Clearly, powerful environmental factors must be forcing this migration. But what might those factors be?
Many mechanisms have been proposed as triggers for the onset of the migration. Biomass models based on forage and nutrients and the effects of carnivores have all been invoked, but none has explicitly included rainfall, and the models' predictive power has proved to be low. They all fail to consider unused forage, do not explain why animals migrate and cannot predict the timing of the migration, which may vary by as much as three months. Curiously, although hydrological data have been collected for the park for many years—for example, rainfall for 38 years and river discharge for four years in the 1970s—this information seems to have been ignored when searching for causes for the migrations. Likewise, vegetation changes over decadal time scales have been reported only casually.
To look deeper into the driving forces of the Serengeti ecosystem, we chose to collect water-quality data and merge them with the available hydrologic data. Using both numerical and graphical techniques, we then analyzed the data to reveal any correlations between water quantity and quality and both the timing of migration and vegetation types and availability. Our studies have led us to propose that water quality, as well as quantity, makes up the dominant force driving the Serengeti ecosystem. Not only do these factors explain the timing of the wildebeest migration, but they also suggest why vegetation occurs in the patterns that it does.
Although the Serengeti ecosystem includes areas outside Serengeti National Park, we chose to restrict our study area to within park boundaries, where data are most available and reliable. The park covers approximately 15,000 square kilometers, about the area of Connecticut, and is drained by the Mara, Grumeti and Mbalageti Rivers, all of which flow westward to Lake Victoria (see Figure 2). The Mara passes through the park in the far north, at 1,300 to 1,500 meters of elevation, and drains a total of 10,300 square kilometers, most of which is in Kenya. The Grumeti, with a total catchment area of 11,600 square kilometers, drains much of the wooded savanna of the central and northern hills much inside the park's boundaries. To the south, in an area of treeless grasslands and hills lying between 1,600 and 1,660 meters in elevation, the Mbalageti drains 2,680 square kilometers, nearly all within the park.
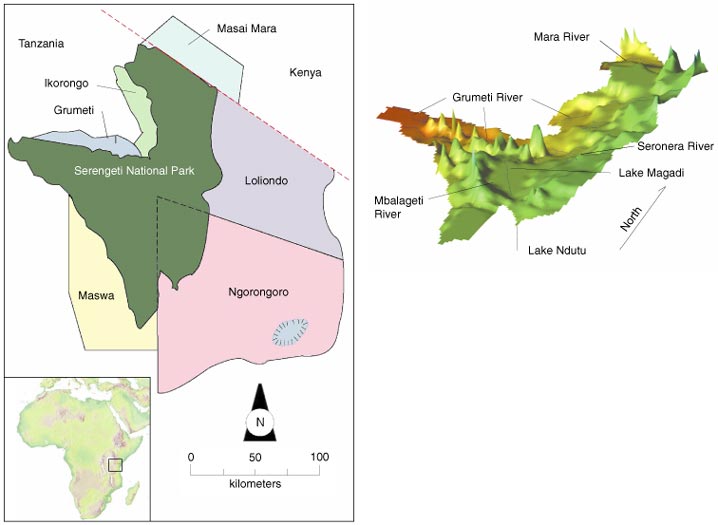
Linda Huff
In general, river flows, as indicated by data collected daily from 1970 to 1974, are not indicative of drainage area. The Mara, which was gauged at its entrance to the park, had a peak flow of 1,000 cubic meters per second. The Grumeti, with a similar drainage area, saw a maximum of 200 cubic meters per second at its exit from the park. To the south, the Mbalageti peaked at only 40 cubic meters per second where it left the park. These flows vary greatly with the season. After the rains, discharges decrease exponentially to base flows maintained by groundwater seepage. The Mara reaches its base flow a few months after the rains end, whereas the Grumeti and Mbalageti decline to essentially zero flow within weeks and days, respectively. Thus during much of the year, the Grumeti and Mbalageti consist of a series of stagnant pools tens to hundreds of meters long and less than a meter deep, except where hippopotami constantly stir them and prevent siltation. These stagnant pools are the only source of drinking water for wildlife during the dry season.
We analyzed monthly rainfall data from January 1960 to June 1989 from 232 stations, not all of which were operational continuously. Rainfall peaks are reached in April and minimums in August or September. There is also large interannual variability, although this has little effect on the seasonal pattern. The amount of annual rainfall does not correlate significantly with the Southern Oscillation Index (a measure of climatic patterns in the tropical Pacific) in this part of Africa, although major El Ni?o Southern Oscillation (ENSO, a disturbance in climatic patterns in the tropical Pacific) events were clearly reflected in increased rainfall (see Figure 3). Sub-Saharan climate is also known to be influenced by quasi-biennial oscillations of the atmosphere (QBO) and by interactions between the global ENSO signal and tropical Atlantic and Indian ocean processes, such as monsoon convection, with time lags of 12 to 18 months.
Aaron Cox
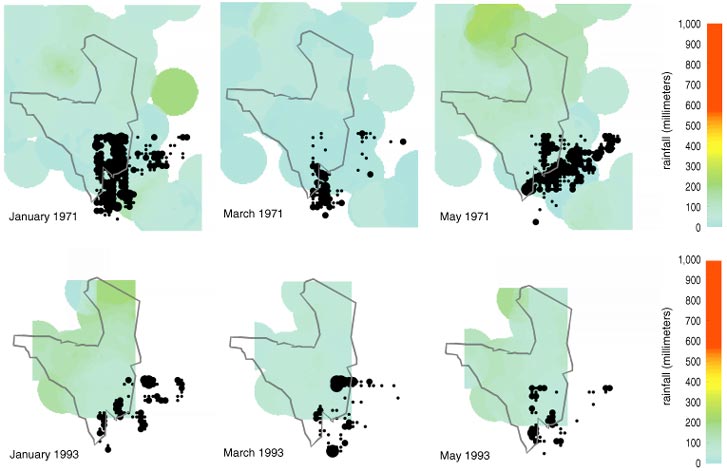
In general, rainfall is greatest in the northwestern and extreme southeastern corners of the park, exceeding 110 centimeters per year in the northwest, and least in the east, at about 50 centimeters per year (see Figure 4). A rain shadow downwind of the Ngorongoro Mountains makes the southern grasslands the driest area of the park. When the rainfall data are computer animated, it becomes apparent that rainfall generally intrudes into the park as fronts from the north and the southeast. On an interannual basis, the southeastern rainfall dominates in very wet years (top 10 percent), whereas the northern rains dominate in dry years.
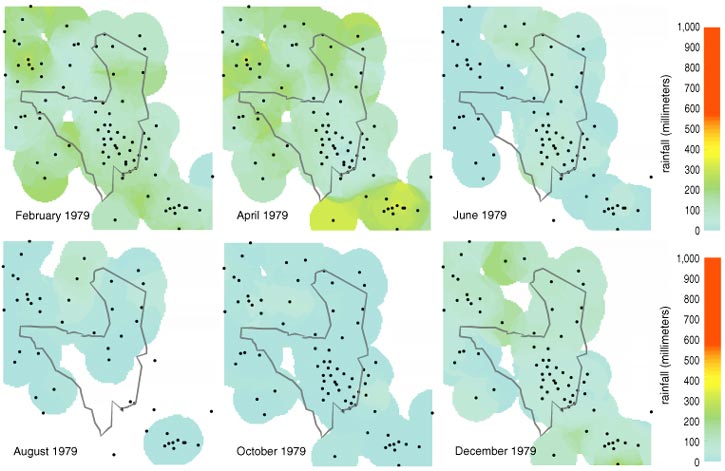
Linda Huff
Rainfall was negligible in the southern grassland in 1969 but abundant in 1989. These are extreme years in an overall pattern wherein mean annual rainfall was about 50 percent higher during the mid-1970s and late 1980s than it was during the early 1960s. These patterns are clearly reflected in vegetation, with the boundary between wooded savanna and grassland moving southward during the wetter decades. Nonetheless, other factors may influence this boundary shift, including the discouragement of man-made fires and the poaching of 70 percent of all elephants during the 1980s. Elsewhere, in Congo's Virunga National Park, the killing of elephants led in only 20 years to the transformation of grasslands into densely wooded savanna, despite continuing wildfires.
Rainfall and river flow clearly influence the movement of migrating species of herbivores in the Serengeti ecosystem, but the mere timing or quantity of water arrival cannot precisely explain when the animals will begin to move. They will be in the south during the wet season and back in the northwest by the dry season, but, as noted previously, the move out of the south may vary by as much as three months from year to year. There is clearly more at play in this equation.
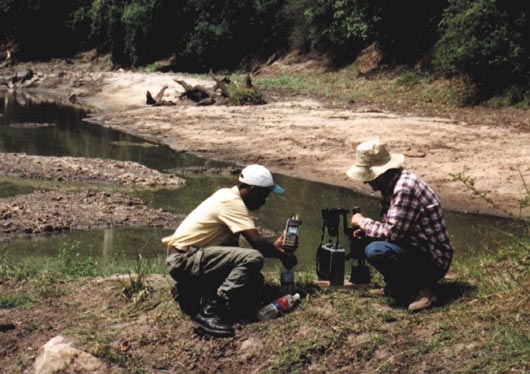
We measured water pH, salinity, dissolved oxygen and temperature (20 centimeters below the surface) at 49 stations in most rivers and other water bodies in the park every three months from April 1996 to April 1999. We also measured the vertical distribution of these parameters at some of these sites, estimated visibility and collected undisturbed samples for microscopic analysis of suspended matter.
Linda Huff
Although water quality may be reasonably good in rivers during the wet season, the picture changes markedly during the dry season. Stagnant ponds are heavily used by wildlife, and the water reflects this abuse. Animal dung generates algal blooms in the surface waters of most ponds, and wildlife tramples the bottoms, further increasing turbidity. As a result, visibility is commonly less than 3 centimeters, and about 40 percent of ponds have visibility of less than 1 centimeter. Except for the top few centimeters of water, there is complete darkness.
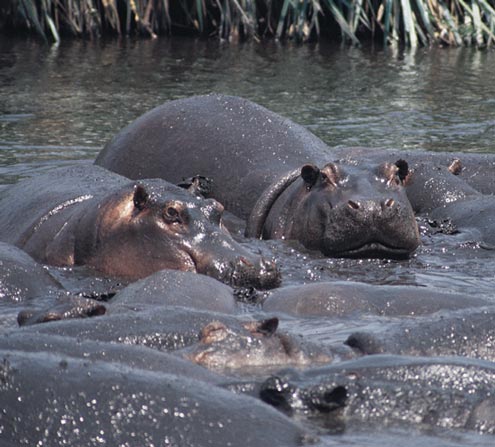
Suspended matter consists of macro-aggregates made of organic matter (500-5,000 micrometers in diameter) and small mud flocs (less than 100 micrometers in diameter). Because of the turbidity, the water is highly thermally stratified (2 degrees Celsius per meter), which inhibits vertical mixing and aeration of deeper water. Aeration of bottom waters takes place only when hippos stir the water (see Figure 7) or when warm layers develop along the bottom (perhaps as a result of decaying animal dung and other organic matter). Thus dissolved oxygen levels also have a strong vertical gradient, varying diurnally from about 1.1 to 8 parts per million (ppm) at the surface and 0 to 4.5 ppm at the bottom. Bottom waters in our study were anaerobic about 10 percent of the time.
Linda Huff
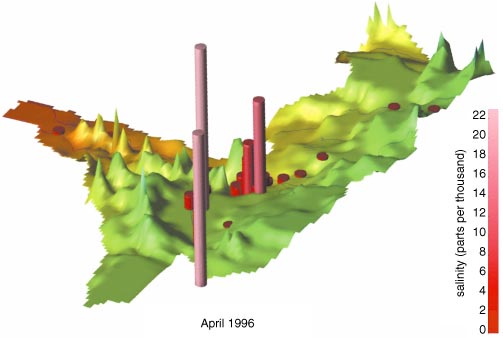
Among the data we collected on water quality, salinity proved to be perhaps the most interesting. In general water salinity is highest in the grasslands in the southern portions of the park. Most water was very saline in the southern grasslands during the 1996 wet season, whereas sweet water prevailed at the same time in the north. In April of 1996, at the peak of the wet season, salinity was commonly 5–15 parts per thousand in the southern grassland, 0.5–20 in the Seronera River (a small tributary to the Grumeti River), 1.8–5.8 in the Mbalageti River, 0.5 in the Grumeti and less than 0.1 in the Mara River (see Figure 5).
Charles V. Angelo (Photo Researchers, Inc.)
During the dry season, evaporation dries out the water holes of the southern grassland, leaving salt behind. The 1997 wet season was drier than that of 1996, resulting in less dilution and even higher salt concentrations. The alkaline lakes Ndutu and Magadi reached a wet-season minimum salinity of more than 20 in 1996 and 1997, but, with the increased rains of 1998, these levels dropped by half. Note also that the salinity in the Seronera River during the 1998 wet season was relatively constant along its length, suggesting that flooding had homogenized the water along the river's course.
Although salinity can be quite high in the headwaters of the Seronera and Mbalageti rivers, salinity decreases rapidly downstream in both rivers to a level of less than 1 in their lower reaches. The salinity shows much variability during 1996 and 1997 along the course of the Seronera River (the most heavily sampled body of water in our study) at 18 stations. When salinity exceeds 4, no grass grows along the banks of the rivers, and, when it drops below 2, the vegetation changes from grassland upstream to wooded savanna downstream. (Coincidentally, rice cannot be irrigated with water whose salinity is greater than 2.) We propose that salinity variations on decadal time scales may control the discontinuity between grassland and wooded savanna.
Furthermore, we argue that excessive salinity may be the trigger that starts the migration of wildebeests and zebras from their wet-season range in the southern grassland to the northwest. During 1996 and 1997, we observed the animals beginning their migration when there was still plenty of forage and surface water in the area to sustain the herds. The salinity of the water, however, was very high. No data are available on the length of time that wildebeests and zebras can survive on such high-salinity water. Sheep, however, have an upper limit of about 10 over the course of a few months. In the arid Kalahari-Gemsbok National Park of South Africa, groundwater is pumped to ponds for wildlife. Where the water is hard and saline, the wildebeests leave; where it is sweet, they stay.
Based on this hypothesis, we have developed a model that predicts the timing of migration as a function of salinity. We use the salinity levels in Lake Magadi to provide a single number that is roughly proportional to the numerous water sources in the southern grasslands. Although the Seronera and Mbalageti rivers are more important water sources and are considerably less saline overall than Lake Magadi, their salinities appear to vary with good agreement. The model begins on April 15 of each year and calculates a threshold value for salinity that will coincide with the day the migration passes by Seronera (halfway between sites 1 and 18 on the Seronera River).
Photograph courtesy of Eric Wolanski, Emmanuel Gereta, Markus Borner and Simon Mduma.
The model takes into consideration initial salinity in Lake Magadi, water depth (which begins at the same depth each year because of a sill), the evaporation rate and rainfall. Observations in 1996 indicated that 30 is the threshold value for migration from the southern grassland to the woodlands. Thus we were able to predict the migration timing for 1997 through 1999 by estimating when the waters of Lake Magadi would reach that value. In each case, our prediction (made early in April) for the migration was within one week of being correct (late April in 1996, early May in 1997, late July in 1998 and late June in 1999, when our estimate was only one day off).
It is quite likely that actual measurements of salinity in a sample body of water will prove unnecessary in the long run to predict migration. Because rainfall and salinity are inversely proportional, we think that a rainfall-runoff model could predict salinity and thus migration. Moreover, a previously developed rainfall-runoff model for the Mbalageti River could be used to estimate previous salinities, and hence migrations, over the past 38 years. These data could be related to historical information from aerial observations of migration routes and of vegetative patterns to construct a deterministic model of the Serengeti ecosystem.
The ability to predict the movement of more than a million animals across Serengeti National Park is far from an academic exercise. The park and its wildlife have been described as one of our planet's greatest treasures, yet its very size and diversity make its management a monumental task. With a model to predict the migration, wildlife managers will be able to separate uncontrollable effects on wildlife, such as rainfall variations, from effects that can be managed, such as fires, water impoundment and poaching. We have already developed a rainfall-driven model for the biomass of grass, wildebeests and carnivores that apparently reproduces observations from 1960 to 1998 quite faithfully. It may prove to be a vital tool for helping to manage an endangered and spectacular resource.
Aaron Cox
Finally, although the salinity model may be the most important outcome of our work, we propose that further work should be done on the effects of water quality on wildlife. Water as poor as we sampled in the park has had documented negative effects on cattle, yet essentially nothing is known about how such water may affect wildlife population dynamics. Indeed, 70 percent of the annual mortality of wildebeests occurs in the dry aseason as a result of unkown factors—definitely not poaching or predation but perhaps poor water quality. The current practice of storing water to encourage concentrated wildlife populations to please tourists may negatively impact those very animals. Furthermore, drinking water for wildlife in the dry season is increasingly threatened by waste from tourist lodges in the park, cattle in buffer zones around the park and siltation from erosion along tourist roads. We don't know how significant these influences are, but it may be vitally important that we find out.
This study was supported by the TANAPA, AIMS, FZS, the IBM International Foundation and the K.L. Alexander Trust. The authors thank Brian Farm, Ernest Sitta, Felicity McAllister, Simon Spagnol, Katie Moore and Craig Packer.
Click "American Scientist" to access home page

American Scientist Comments and Discussion
To discuss our articles or comment on them, please share them and tag American Scientist on social media platforms. Here are links to our profiles on Twitter, Facebook, and LinkedIn.
If we re-share your post, we will moderate comments/discussion following our comments policy.