Flying and Driving after the September 11 Attacks
By Michael Sivak, Michael Flannagan
A statistical analysis of the relative risks
A statistical analysis of the relative risks

DOI: 10.1511/2003.11.0
Many people who are perfectly relaxed cruising our nation's highways become jittery when they get on an airliner—although most know full well that flying is safer than driving. The statistics are indeed clear on this point. For example, we and a colleague, Dan Weintraub, published a paper in 1991 that documented the substantially lower risk of flying compared with driving in the United States. Some of the many millions of Americans who flew over the next few years probably derived comfort from such hard facts. But now, a decade later, things have changed: The hijacking of four large jets on September 11, 2001, and the disastrous events that ensued led many to forgo flying in the United States during the following months. For example, in the fourth quarter of 2001, there was a drop of 18 percent in the number of passengers compared with the same time period in 2000. Many still avoid air travel. We thus thought it appropriate to again calculate the risks involved in flying and driving, taking into account the latest statistics, including the tragic deaths of the passengers on those four hijacked planes.
The risks of flying and driving are influenced by different parameters. Whereas the risk of driving depends most strongly on the distance traveled, the risk of flying is primarily affected by the number of takeoffs and landings. A study carried out by Boeing indicates that out of 7,071 worldwide airline fatalities during the interval between 1991 and 2000, 95 percent happened either during takeoff and climb after takeoff, or during descent and landing. Conversely, only 5 percent of the fatalities resulted from accidents that occurred at cruising altitudes. Consequently, as we and others have pointed out before, the risk of flying depends mostly on the number of flight segments involved in the trip, not on the distance traveled.
In gathering the statistics for flying, we considered the scheduled domestic passenger operations of 10 major U.S. airlines: Alaska, America West, American, Continental, Delta, Northwest, Southwest, TWA, United and USAirways. (The commuter affiliates of these airlines were not included.) Because the number of airline fatalities varies greatly from year to year, we used the data compiled by the National Transportation Safety Board for a 10-year period from 1992 through 2001. To calculate the probability that a particular passenger would be killed on a nonstop (one-segment) flight, we divided the number of passengers killed during 1992–2001 (433, including the 232 aboard the four hijacked flights) by the product of the total number of nonstop segments (54,061,237) and the average number of passengers per nonstop segment (101.9). The resulting value is 78.6 X 10⁻⁹, or roughly eight in a hundred million.
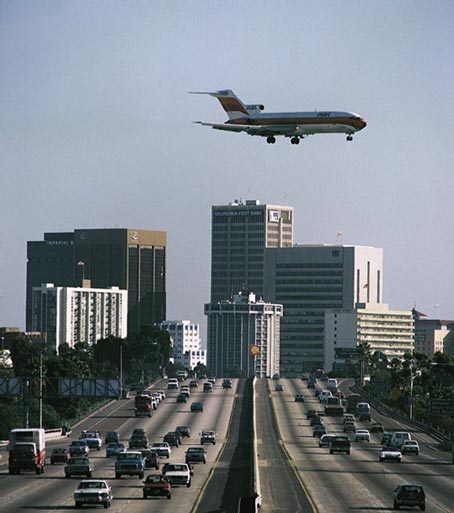
Jerry Schad / Photo Researchers, Inc.
The probability of a fatality on a one-stop (two-segment) flight can be calculated by combining the probabilities of a fatality on either segment. Roughly speaking, the probability of becoming a fatality on a two-segment flight is just two times the probability of becoming a fatality on a one-segment flight. (In actuality, because one must survive the first segment to become a fatality on the second, the full probability calculation is more complicated. But given the very low probabilities involved here, the simple approximation is quite accurate.) Similarly, the probability of a fatality on a three-segment flight is approximately equal to three times the probability for a single-segment flight, and so on.
Tom Dunne
When one decides between flying and driving, the latter option usually involves being the driver (as opposed to a passenger). Because the susceptibility to injury varies with the position of the occupant in the vehicle, we included only drivers in this analysis. Also, we tallied just cars, light trucks, vans and sport utility vehicles, ignoring heavy trucks, buses and motorcycles. Furthermore, we considered travel just on rural interstate highways—the safest driving environment—because those constitute the most likely setting when one chooses to drive as an alternative to flying. To gauge the risks of such motoring, we used statistics from the year 2000, the most recent data available in detail.
To calculate the probability of fatality per kilometer of driving, we divided the number of driver fatalities on rural interstate highways in 2000 (1,511) by the estimated distance traveled on those roads by cars, light trucks, vans and SUVs (345 X 109 kilometers). The resulting value is 4.4 X 10⁻⁹, or about 4 in a billion per kilometer.
Armed with these two risk estimates, one for driving and the other for flying, we can specify something we call the indifference distance—the distance at which the two modes of travel are equally risky. For distances shorter than the indifference distance, driving is safer; for distances longer than the indifference distance, flying is safer. The indifference distance for driving versus a nonstop flight can be calculated by dividing the risk of flying a nonstop segment (78.6 X 10⁻⁹) by the risk of driving a kilometer (4.4 X 10⁻⁹). The result is 18 kilometers. For one-stop and two-stop flights, the indifference distances are 36 kilometers and 54 kilometers, respectively. Thus for any distance that is long enough for flying to be an option, driving even on the safest roads is more risky than flying with the major airlines.
Astute readers will note that our calculations do not include the trip to an airport (for flying) or the travel on local roads on the way to a rural interstate (for driving). True, we've overlooked this complication. But in many circumstances, the risks for these portions of the journey for the two modes of long-distance travel may be about the same. So we don't believe that our estimates of indifference distance would change all that much, even if such factors were fully accounted for.
Just how much safer is flying than driving? For an average-length nonstop flight (which works out to 1,157 kilometers), the risk of flying is just the 78.6 X 10⁻⁹ value derived above. The risk of driving those same 1,157 kilometers is 1,157 X 4.4 X 10–9, or 5,091 X 10–9. Dividing 5,091 by 78.6, we estimate that driving the length of a typical nonstop segment is approximately 65 times as risky as flying. Driving farther than 1,157 kilometers would be more than 65 times as risky; driving shorter than 1,157 kilometers, but longer than the 18-kilometer indifference distance, would be between 1 and 65 times as risky as nonstop flying (neglecting the drive to the airport and the travel on local roads on the way to the interstate).
As all those stock prospectuses say, these figures are descriptive for the time period studied and are not predictions of future performance. Making predictive statements about the relative risk of flying and driving after the attacks of September 2001 is indeed tough. In particular, it requires some assumptions about whether such aberrant events will be repeated and, if so, how often. Because the frequency of such episodes cannot be reliably estimated, we instead decided to calculate the frequency needed for the two travel modes to become equally risky.
As we explained above, the risk of a fatality while driving the length of an average nonstop flight is 5,091 X 10–9. For nonstop flights to have had the same estimated risk, there would have to have been 28,046 flight fatalities over the 10-year period studied (based on 54,061,237 nonstop segments and 101.9 passengers per nonstop segment). That translates to 27,845 flight fatalities in addition to the 201 people who actually died over those years (not counting those on the four hijacked flights). In turn, dividing 27,845 by 232 (the number of passengers who died on the four hijacked planes) we obtain the following: For flying to become as risky as driving, disastrous airline incidents on the scale of those of September 11th would have had to occur 120 times over the 10-year period, or about once a month.
Two conclusions follow. First, without diminishing the tragedy of September 11th (which also involved many deaths of people on the ground) or its political ramifications, from the perspective of personal safety it is important to consider that the annual number of lives lost in road traffic accidents in the United States is enormous in comparison (42,119 fatalities in 2001). Second, the relative safety of domestic flying on the major airlines over driving is so strong that the direction of the advantage would be unchanged unless the toll of terrorism in the air became, almost unthinkably, many times worse than it has been.
Click "American Scientist" to access home page
American Scientist Comments and Discussion
To discuss our articles or comment on them, please share them and tag American Scientist on social media platforms. Here are links to our profiles on Twitter, Facebook, and LinkedIn.
If we re-share your post, we will moderate comments/discussion following our comments policy.