E Pluribus Confusion
By Barry Cipra
There’s more than one way to turn census data into congressional seats
There’s more than one way to turn census data into congressional seats

DOI: 10.1511/2010.85.276
Every decade the United States body politic undergoes a spasm of a decidedly mathematical nature. It will do so again in the next couple of years. That’s when the 2010 census will be used to determine the face of the next Congress, in a computational process called apportionment. The computation boils down to figuring out how many seats each state receives in the House of Representatives. But that glosses over a host of subtleties—and with it, a history of political rancor.
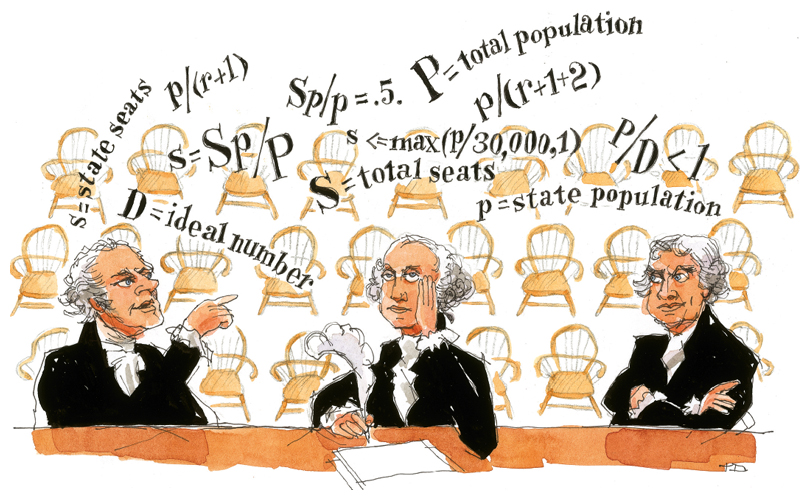
Tom Dunne
It wouldn’t seem that hard: You take the census state by state, you settle on the size of your House, and you assign each state a number of seats in proportion to their percentage of the total population. The solution is expressible in a formula that a grade-schooler can grasp: s=Sp/P, where s is the number of seats a state with population p should receive in a House with S seats altogether for a nation with P people in all. Under current law, the formula is even simpler: Since 1964, the size of the House of Representatives has been fixed at 435, so s=435p/P.
The problem, of course, is that Sp/P is rarely a whole number. Apportionment is a matter of turning fractions into integers. You might think the Constitution would have specified a procedure for doing so. It doesn’t. The closest it comes to a formula for anything actually turns integers into fractions: Our founding fathers called for the census to count each slave as three-fifths of a person. The Consitution left it up to Congress itself to decide not only how big to be, but how to dole out the seats. Its only stipulations were that each state get at least one seat, and that there not be more than one representative for each 30,000 people. If you like formulas, that’s 1 ≤ s ≤ max(p/30000, 1).
The one-per-30,000 ceiling was a serious constraint early on. Indeed, it entered into the argument over the initial size of Congress. Nowadays it’s not an issue, with the smallest state, Wyoming, having nearly a half-million residents.
Most people, when asked for a reasonable way to turn fractions into integers (and you may wish to stop reading for a moment to see what comes to mind), propose something along the following lines. First, note that each fraction Sp/P—called the state’s quota—lies between two consecutive integers, so start by rounding to the nearest integer, with whatever rule you like for handling the unlikely possibility that the fractional part of Sp/P is exactly one-half. If the sum of all these rounded numbers turns out to be exactly S, you’re done. If it’s less than S, find the states with the largest quotas that got rounded down, and give them an extra seat until the total gets up to S; similarly, if it’s more than S, find the states with the smallest quotas that got rounded up, and take seats away from them (subject to the constitutional guarantee that you don’t reduce a 1 to a 0).
If you don’t like the notion of taking seats away after initially allotting them, an equivalent method is to round everyone down at first, then give an additional seat each to states with the largest fractional parts until you get to S. Whichever rounding route you take, this approach is named after Alexander Hamilton, who offered it as the rationale behind the first apportionment bill passed by Congress in 1792 and sent to President Washington for his signature.
It was the first bill ever vetoed.
The veto came at the urging of Thomas Jefferson, who had his own idea for apportioning seats. Jefferson’s approach was to pick an ideal number D for the size of a district—he liked the number 30,000—then divide it into each state’s population p, and round the result p/D down to the nearest integer to get s. If the total number of seats misses the target, Jefferson noted, you can go back, modify D either up or down, and try again.
You might worry that Jefferson’s method might never find a value of D that produces a House of size S—or, worse, that two different values of D would apportion the S seats differently. But neither worry is necessary. There is always a range of values for D that produces an apportionment with S seats, and you get the exact same apportionment for anything in the range.
One way to see this is to imagine starting with a value of D so unrealistically large that every state’s quotient, p/D, is less than 1, so nobody gets a seat. Then start reducing D. As you do so, each state’s quotient increases, and every so often some state’s quotient will reach and then exceed an integer value. If you ignore the unlikely possibility that this happens to two or more states simultaneously (or if you invent a tie-breaking rule to handle such a scenario), you can think of the House as growing in size from 0 all the way up to P, with seats being doled out one at a time.
If, once all the seats are doled out, some states are unrepresented, it may be necessary to take the last few doled-out seats back and reassign them to the unrepresented states, in order to satisfy the constitutional requirement. Were Jefferson’s method currently in use, something like this would have happened in the last apportionment: Based on the 2000 census, neither Wyoming nor Vermont would have received a seat under a “pure” Jeffersonian method; the last two seats would have gone to Minnesota and Pennsylvania.
Such issues notwithstanding, the notion that seats in Congress can be doled out one at a time until the House is full has a certain conceptual appeal. In fact, if you didn’t come up with Hamilton’s method earlier, it’s likely you came up with something along the following lines (and again, you may wish to see what comes to mind before reading further): Line the states up from biggest to smallest and give each one a seat to start with, thus taking care of the constitutional requirement right off the bat. At each step thereafter, keep a list, in decreasing order, of the ratios p/r, r being the current number of seats a state has been assigned. Now give the next seat to the state at the top of the list, decreasing its ratio to p/(r+1), and reinsert the state into the lineup to keep the list in decreasing order. This makes intuitive sense, since p/r is a measure of district size: It is the number of people represented by each of the seats.
If this is what you thought of, then you’re in league with John Quincy Adams. Jefferson’s method was used for the first five apportionments, but by the 1830s politicians from New England began grousing about being cheated out of seats. Jefferson’s method, it turns out, favors large states (of which his home state of Virginia was right at the top in 1790 and 1800) in a peculiar way: It has a penchant for assigning large states more seats than their quota suggests. In 1820, for example, New York and Pennsylvania had quotas of 32.503 and 24.917, respectively, yet wound up with 34 and 26 seats (out of 213 altogether). In 1830, New York was again granted an “extra” seat, receiving 40 despite a quota of 38.593.
Adams proposed a method that has the opposite effect. His approach is identical to Jefferson’s in that it divides a test number D into each state’s population p, but instead of rounding down, Adams’s method rounded up each quotient p/D. When all the math is said and done, it turns out this approach doles out seats in the fashion just described—in other words, according to the largest ratio p/r.
Indeed, the “pure” Jefferson method can also be described this way, except that the ordered list consists of ratios p/(r+1)—that is, states are prioritized according to how they would stand after another seat were added. A nice way to think of this algorithmically is to let the Adams approach run past 435, assigning all the way to 485 seats, and then ignore the first 50 assignments (thus taking away the first 50 seats, which went one to each state).
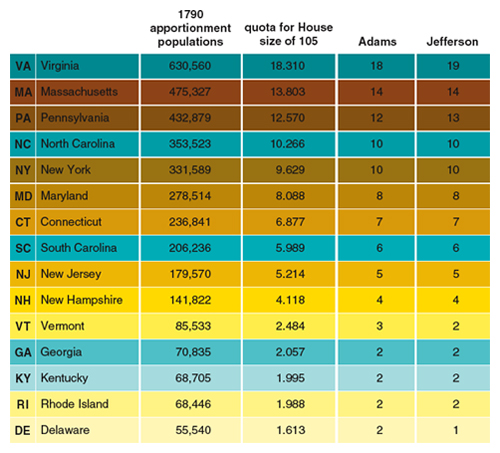
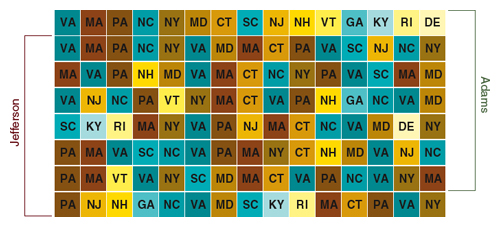
It’s instructive to see how the methods of Adams and Jefferson would have doled out the 105 seats of the first Congress, based on the 1790 census for the 15 states then comprising the United States. The populations are given in the second figure (page 278), along with their Hamiltonian quotas and the apportionment tallies for the two methods. The doling out of the seats appears in the third figure (page 279). The Adams apportionment is rows one through seven in the third figure; the Jefferson apportionment is rows two through eight. Note that Virginia and Pennsylvania appear twice in the last row, whereas Vermont and Delaware appear not at all.
Adams’s method tends to shortchange the large states. In 1830, it would have given New York (quota 38.593) only 37 seats and Pennsylvania (quota 27.117) only 26. In general, Jefferson’s method never gives less than the quota rounded down, and Adams’s method never gives more than the quota rounded up—and for the most part, it’s the large states that wander above or below what their quotas would suggest.
Needless to say, Adams’s method was rejected in favor of Jefferson’s. But when the 1840 Census rolled around, Congress split the difference, so to speak, and used a method proposed by Daniel Webster. Webster’s method also uses a divisor D to produce quotients p/D, but instead of rounding everything up (Adams) or down (Jefferson), Webster rounds to the nearest integer—up if the fractional part is greater than 0.5 and down if it’s less. As a doling-out algorithm, Webster’s method amounts to keeping an ordered list of ratios p/(r+½).
Barbara Aulicino
Webster’s method was only used once. With the 1850 census, Hamilton’s method snuck back in, and it stayed on the books for the rest of the century—until it became too much of an embarrassment. Hamilton’s method, it turns out, does strange things.
This idiosyncrasy became apparent with the 1880 census. The chief clerk of the Census Office noted something odd when he computed how Hamilton’s method apportioned seats for various House sizes ranging from 275 to 350: In a House with 299 seats, Alabama, with a quota of 7.646, got rounded up, but in a House with 300 seats, Alabama’s quota of 7.671 got rounded down!
What accounts for the “Alabama paradox” is the fact that at 299, Alabama’s fraction, 0.646, barely beat out those of both Illinois (quota 18.640) and Texas (quota 9.640) for the “last” seat (meaning Alabama’s fraction was the smallest one to get rounded up). But at 300, Illinois’s quota went to 18.702, easily overtaking Alabama’s 0.671, whereas Texas’s quota squeezed by at 9.672. In effect, Illinois overtook Alabama for the 299th seat, and Texas grabbed the 300th.
Congress dealt with the Alabama paradox by settling on a House size 325, which just happened to be a number where the methods of Hamilton and Webster gave the same apportionment. Much the same took place with the 1890 census: Congress picked a size (356) for which Hamilton and Webster coincided. But in 1900, all hell broke loose.
When Hamilton’s method was applied to the 1900 census for a House size ranging from 350 to 400, Maine’s allotment bounced back and forth between three and four seats: three seats from 350 to 382, four from 383 to 385, back to three at 386, four again at 387 and 388, down again to three at 389 and 390, and back to four from 391 to 400. As Representative John E. Littlefield of Maine put it, “In Maine comes and out Maine goes.... God help the State of Maine when mathematics reach for her and undertake to strike her down.”
Politics being politics, Congress opted for a House of size 386—but jettisoned Hamilton’s method in favor of Webster’s, which allowed Maine to keep its fourth seat. In 1910, Congress again went with Webster, allocating 433 seats among the 46 states then comprising the union, with a specification that Arizona and New Mexico be given a seat each, if and when they became states. Thus Congress reached its current size of 435.
It would seem that Webster had won the day. Then the mathematicians got involved.
In 1911, Joseph Hill, a statistician in the Census Bureau, proposed a new method based on yet another sensible idea: Once you’ve allotted seats to the various states, check to see whether there is any pair of states for which transferring a seat from one to the other makes things more fair between the two of them. By “more fair” Hill meant that the ratio of the ratios p/s (for the first state in question) and p’/s’ (for the second state) should get closer to 1. More precisely, the ratio of the larger ratio to the smaller ratio should get closer to 1. If it does, make the switch and look for another pair of states.
Hill’s method was taken up by Harvard mathematician Edward Huntington, who carried out a spirited debate on the matter throughout the 1920s with Walter Willcox, a proponent of Webster’s method. The politics of that decade were so contentious that Congress never did get around to reapportioning itself. It simply let stand the apportionment based on the 1910 census—a clear-cut case of ignoring the Constitution. (In 1930, Congress caught a break: The two methods happened to produce identical apportionments, so there was no need to choose between them.)
It turns out that Hill’s method can also be run like Jefferson’s, Adams’s and Webster’s, either as a “divisor” method with a funny rounding rule, or as a “doling-out” algorithm with a funky reinsertion rule. The rounding and reinsertion rules involve a lovely piece of mathematics called the geometric mean. When a quotient p/D lies between consecutive integers q and q+1, the rounding rule is to round down if p/D is less than the square root of q(q+1), and round it up if it’s greater than the square root of q(q+1). The reinsertion rule is to keep an ordered list of the numbers:

Hill’s method may look like something only a mathematician could love, but in 1941, Congress did indeed fall in love with it and locked it into law. The affection had little to do with mathematics and a lot to do with politics. Applied to the 1940 census, Webster and Hill gave identical results with one exception: Hill took a seat away from Republican-leaning Michigan and gave it to the solidly Democratic state of Arkansas.
Here’s how Hill’s arithmetic plays out. Webster gave 18 seats to Michigan’s 5,256,106 residents, for a quotient of 292,006. It gave 6 seats to Arkansas’s 1,949,387 people, for a quotient of 324,898. The ratio of these is 1.11264. Hill’s criterion now asks, What would happen if Michigan ceded a seat to Arkansas? The quotients would then be 309,183 for Michigan and 278,484 for Arkansas, and the ratio of these is 1.11024. You can liken it to a bank cutting an interest rate on a loan from 11.25 percent down to 11 percent. The reduction may be small, but it is a reduction, so logic—or more precisely, Hill’s logic—compels you to accept it. If the result just happens to also help solidify your party’s control of Congress, so much the better. As the state motto of Arkansas says, Regnat populus—”The people rule.”
Apportionment methods and census figures provide endless opportunity for political calculus. In 2000, for example, North Carolina’s population of 8,067,673 claimed the 435th seat, its 13th in Congress, under Hill’s method, beating out Utah’s 2,236,714 people, which would have been up for the 436th seat (the state’s fourth) had there been one. That’s because the doling-out algorithm gave North Carolina a population priority of:

—beating out Utah’s:

If Utah had only been able to round up another 856 residents, it would have slipped by North Carolina, with priority:

This is significant, and it occasioned a court case (which Utah lost). The Beehive State’s complaint revolved around who gets counted when the Census Bureau comes up with what’s called the “apportionment population,” which is what goes into the apportionment algorithm. Apportionment population has two components: the ordinary residents of the state—that is, the people actually living in the state at the time of the census—and an overseas population, consisting of military and federal civilian employees and dependents living with them, allocated to their “home” states as reported by the agencies that employ them. Utah had a mere 3,545 such people in its population count, whereas North Carolina registered 18,360. Utah’s problem: There’s no federal agency that pays the salaries of their overseas Mormon missionaries.
Under Webster, Utah would have had less of a case. As it happens, Webster and Hill result in the same apportionment for the 2000 census, and North Carolina still gets the 435th seat. But under Webster, Utah falls behind New York, Texas, Michigan and Indiana (in that order) for the 436th seat, and would have needed an additional 22,235 people to overtake North Carolina.
How things will play out after the 2010 census—in particular, whether there will be any close calls for the 435th seat—remains to be seen. The politics in Washington are so rancorous these days, it’s unlikely Congress will go anywhere near changing what’s on the books, so Hill’s method will likely continue to reign. Many apportionment theory experts consider Webster to be a superior method, but it’s clear from history that Congress is less interested in theory than in the practical results. In the meantime, apportionment is fertile ground for computational play. Call it Sim Congress.
Click "American Scientist" to access home page

American Scientist Comments and Discussion
To discuss our articles or comment on them, please share them and tag American Scientist on social media platforms. Here are links to our profiles on Twitter, Facebook, and LinkedIn.
If we re-share your post, we will moderate comments/discussion following our comments policy.